
Figure 5. Effect of AR(294–556)on LBD sensitivity to DHT in C4-2 cells.
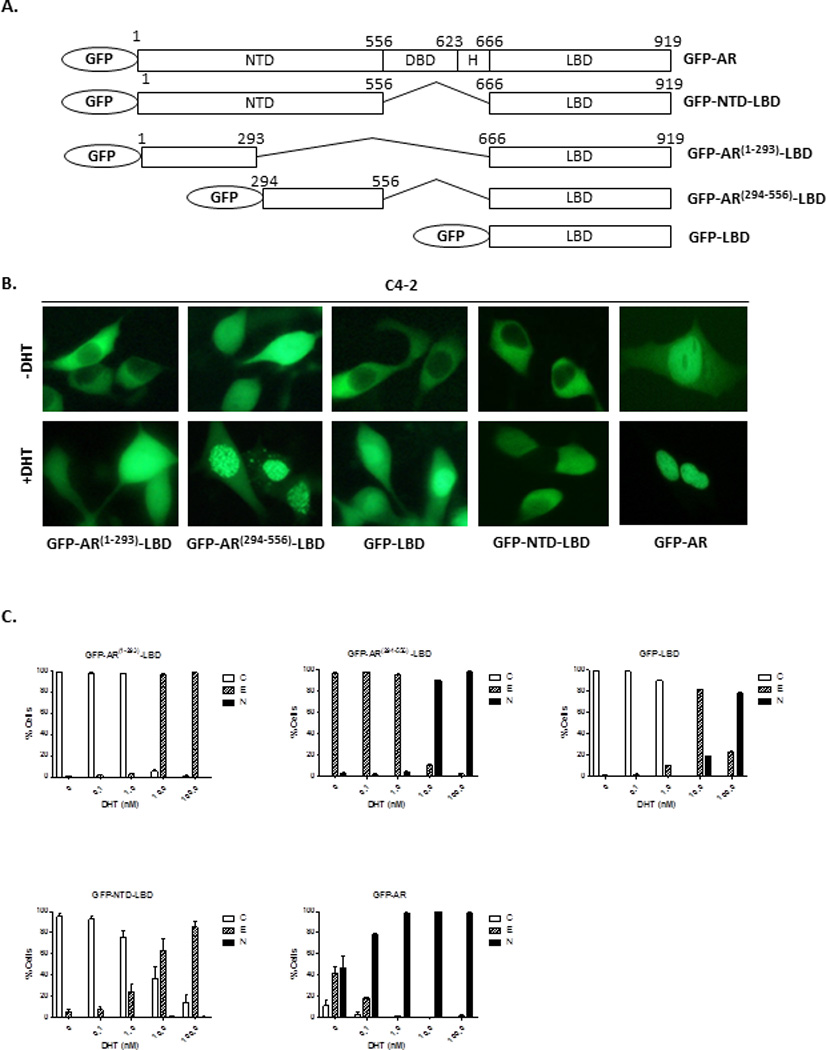
(A) Diagram of GFP fusion constructs GFP-AR, GFP-NTD-LBD, GFP-AR(1–293)-LBD, GFP-AR(294–556)-LBD, and GFP-LBD. (B) Representative images of GFP-tagged protein localization in the absence or presence of 10 nM DHT. (C), Quantification analysis of GFP fusion constructs in C4-2 cells followed by treatment of DHT (0–100 nM) (B). At least 200 cells were counted for each transfection to determine the percentage of the cells displaying cytoplasmic (C), even (E), or nuclear (N) localization. The subcellular localization and quantification of signal were assessed by fluorescent microscopy. The experiment was reproduced 3 times.