
Figure 7. Effect of TIF2 knockdown on AR subcellular localization and PSA expression in C4-2 cells.
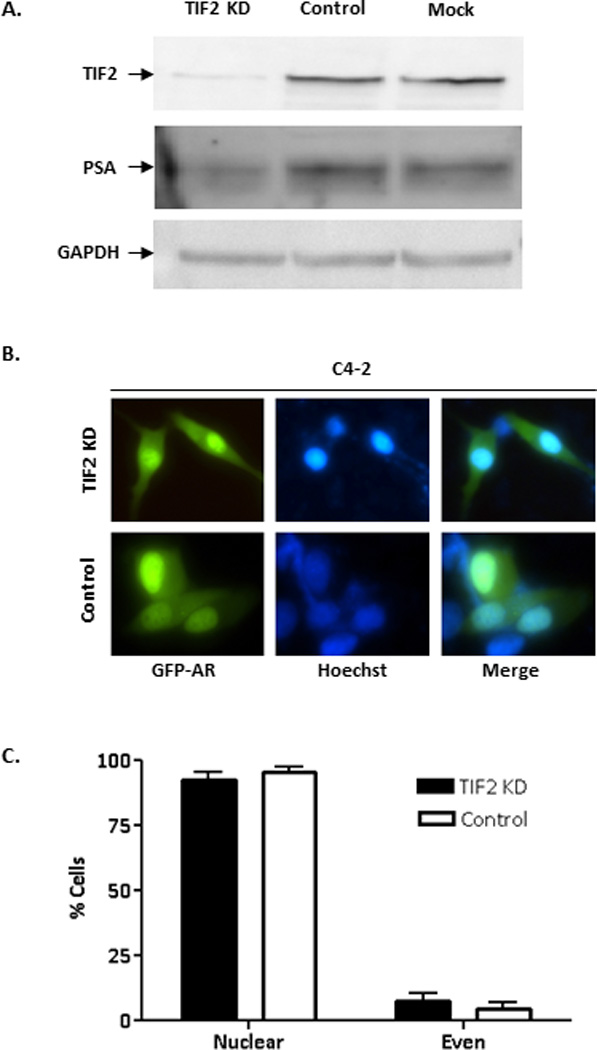
(A) Western blot analysis of C4-2 cells transfected with control siRNA or siTIF2 for 72 hours. The Western blots were probed with anti-TIF2, anti-PSA, or anti-GAPDH (loading control) antibodies. (B) Representative images of GFP-AR in C4-2 cells co-transfected with GFP-AR and either control siRNA or siTIF2 for 72 hours. Localization of GFP-AR was determined using fluorescence microscopy. (C) Percentage of cells displaying nuclear or even localization was determined for GFP-AR in cells co-transfected with either control siRNA or siTIF2. The experiment was reproduced 2 times.