
Figure 3.
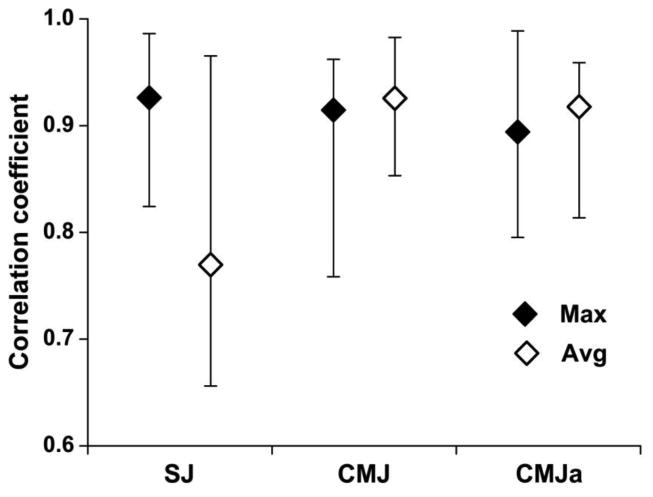
Median correlations (error bars depict their ranges) of the linear F-V regressions observed from 3 jumps and the maximum and averaged F and V variables.
Official websites use .gov
A
.gov website belongs to an official
government organization in the United States.
Secure .gov websites use HTTPS
A lock (
) or https:// means you've safely
connected to the .gov website. Share sensitive
information only on official, secure websites.
Median correlations (error bars depict their ranges) of the linear F-V regressions observed from 3 jumps and the maximum and averaged F and V variables.