
Figure 3.
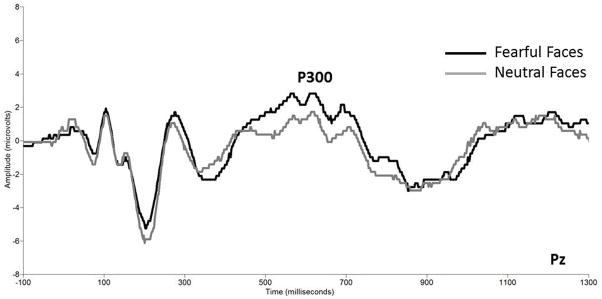
Grand averaged event-related potential waveforms showing the P300 amplitude to neutral and fearful faces at electrode Pz (collapsed across group). The x axis represents latency in milliseconds and the y axis represents amplitude in microvolts.