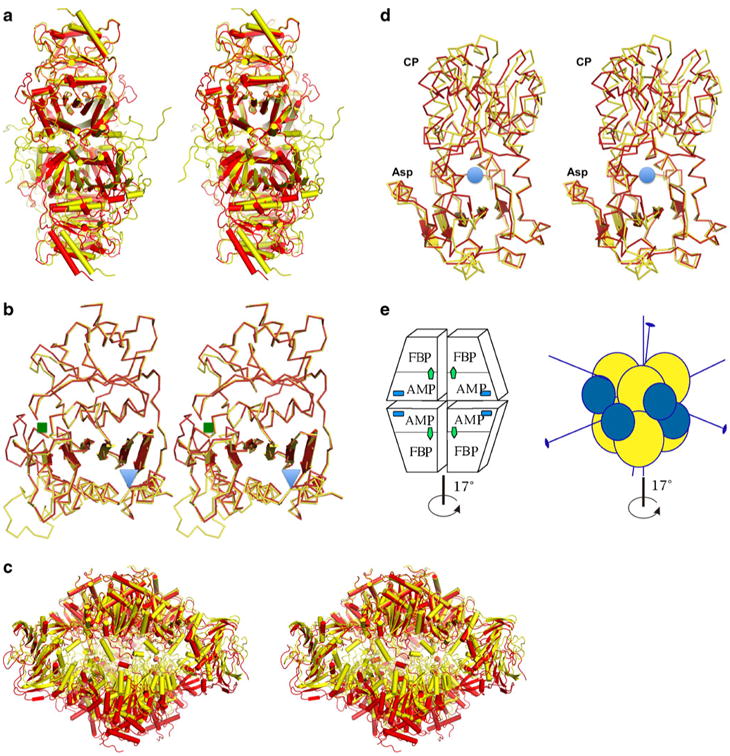
Fig. 1.

Stereo diagram of the allosteric transition showing both the T-and the R-state models as determined by X-ray crystallography, with the T state in yellow and the R state in red for both enzymes. a FBPase tetrameric structures representing both states. b Superposition of the FBPase monomers showing the distortion of the β-sheet; the regulatory site is marked with a blue triangle, while the active site is marked with a green square. c ATCase dodecamer representing a global conformational transition marked by vertical expansion and the rotation of the lower trimer of catalytic subunits bridged by regulatory subunits. d ATC catalytic subunit with Asp and CP binding domains and the active site marked by a blue circle, showing the distortion of the β-sheet of the Asp domain and the resulting conformational transition. e Schematic representation of the quaternary structures of both enzymes, with the main axis of symmetry indicated. The FBPase is composed of four identical subunits that form two dimers rotating around the main axis during the allosteric transition (left panel). The active site is labeled FBP (green arrow), and the regulatory site is labeled AMP (blue square). The ATCase (right panel) is a dodecamer with two catalytic trimers represented by yellow spheres and three regulatory dimers represented by blue spheres. The conformational change in both enzymes is the rotation of the upper dimer (trimer) against the lower dimer (trimer) by ∼17°
