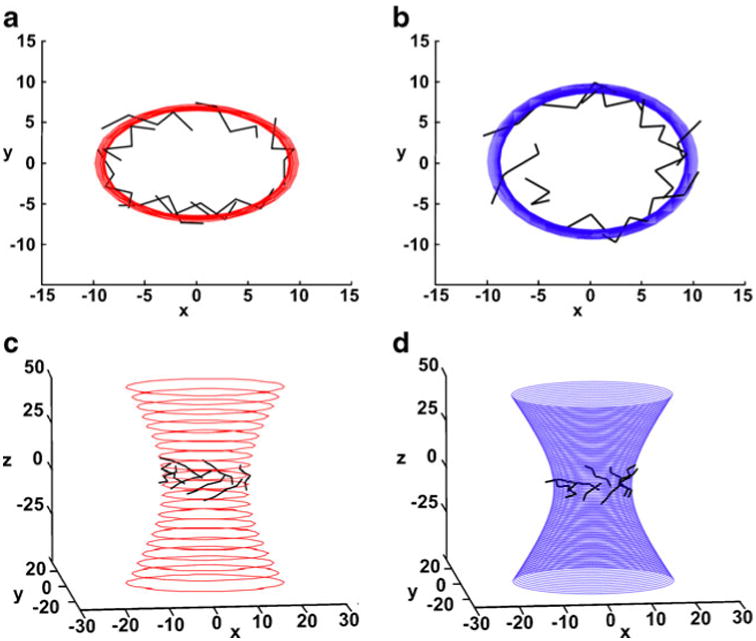
Fig. 2.

Schematic representation of the hyperboloids fitted to the Cα atoms of the β-barrel of (a and c) the triosephosphate isomerase model (TIM-1LYX; hyperboloid in red), and (b and d) the tryptophane synthase (TS-1CXH; hyperboloid in blue). Two views (along the hyperboloid axis and a side view) are shown. The TS barrel is rounder, and the curvature differs by approximately 16%, as seen by viewing along the hyperboloid axis
