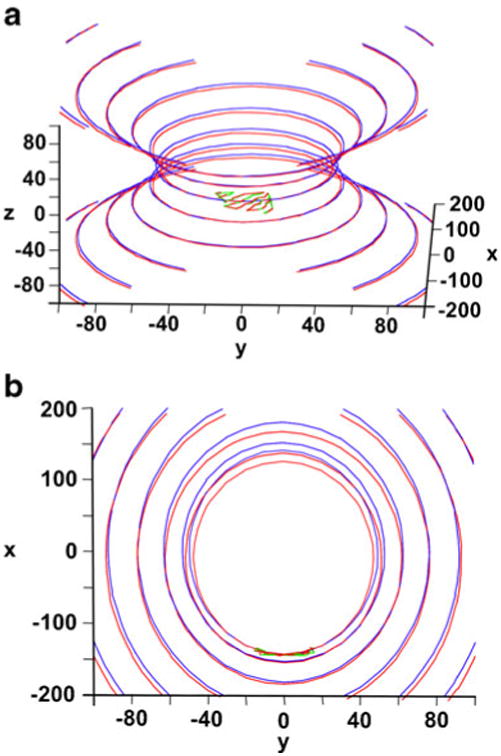
Fig. 3.

The Cα coordinates of the FBPase β-sheet superposed on the optimized hyperboloids (R state of enzyme in red; T state in green/blue): a general view; b view along a major axis, showing a small difference in the canonical parameters of the hyperboloids fitted to both states
