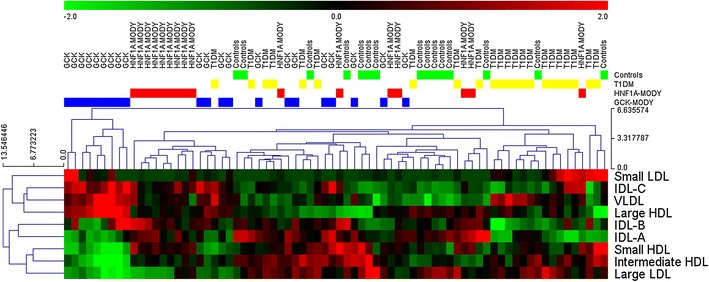
Fig. 2.

Hierarchical clustering plot of lipid profiles. Lipid subfraction levels were standardized across the samples, and Euclidean distance was used to visualize within- and between-group differences. Although the lipid profiles of the majority of patients from the HNF1A- and GCK-MODY groups showed within-group similarities, considerable heterogeneity is evident, which suggests an overlapping effect of environmental and/or other genetic factors
