
Figure 12.
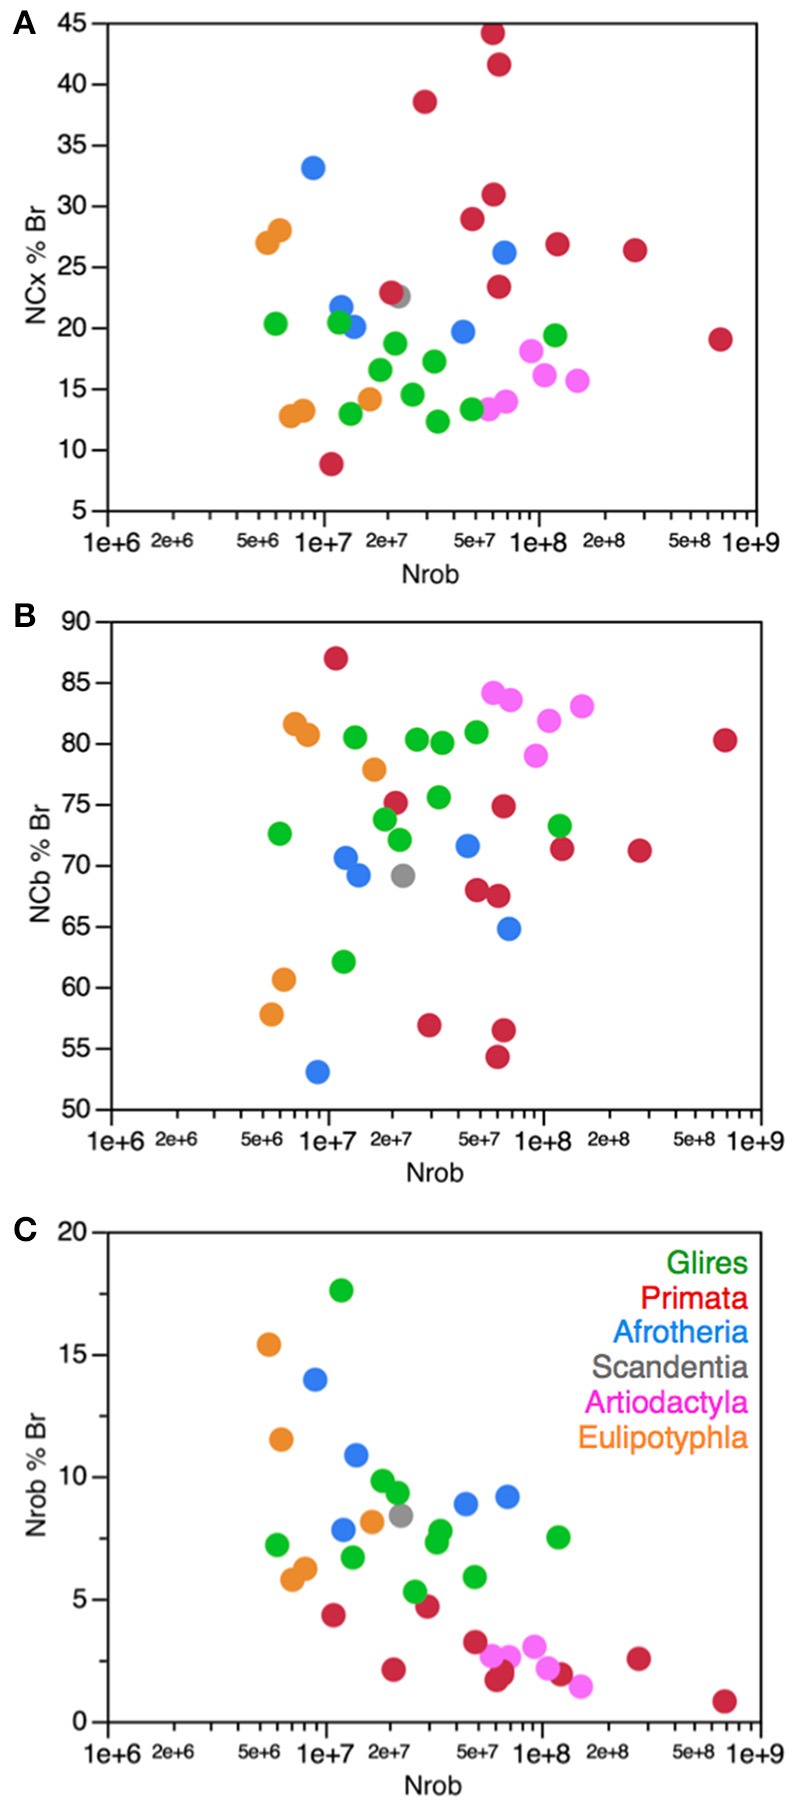
No systematic variation in relative number of brain neurons in the cerebral cortex and cerebellum with variations in the number of neurons in the rest of brain. Each symbol represents the average values for the structures indicated in one species (afrotherians, blue; glires, green; eulipotyphlans, orange; primates, red; scandentia, gray; artiodactyls, pink). (A) The percentage of brain neurons found in the cerebral cortex in each species does not vary in correlation with the number of neurons in the rest of brain (Spearman correlation, p = 0.5242). (B) The percentage of brain neurons found in the cerebellum in each species also does not vary in correlation with the number of neurons in the rest of brain (Spearman correlation, p = 0.3838). (C) The percentage of neurons in the rest of brain, however, decreases significantly with increasing number of neurons in the rest of brain (Spearman correlation, ρ = −0.665, p < 0.0001).