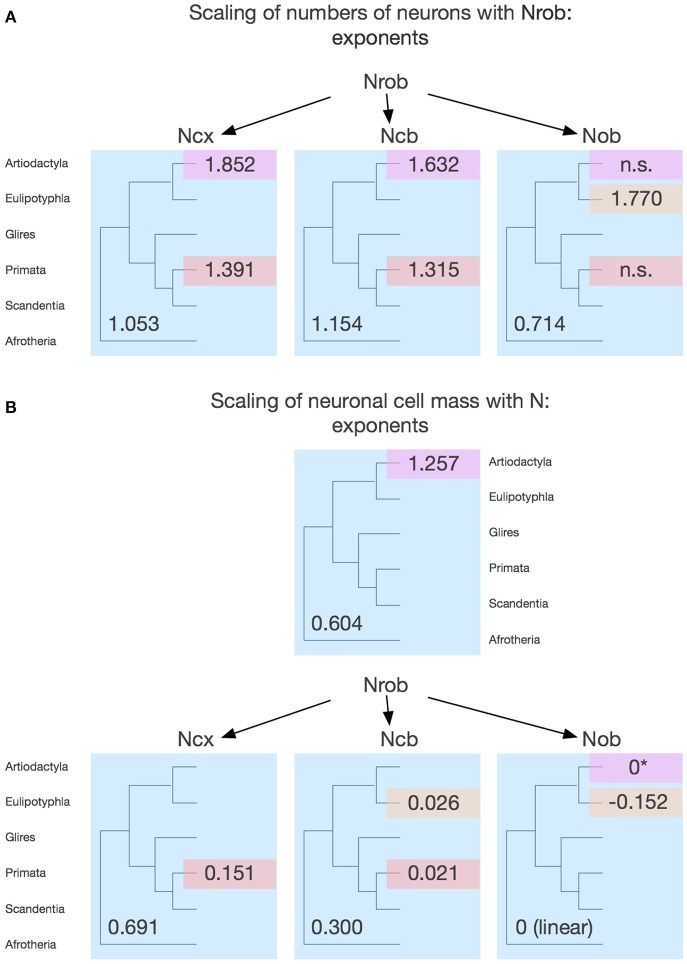
Figure 15.
Schematic of the proposed conserved and mosaic evolution of mammalian brain scaling. (A) Scaling of numbers of neurons in the different brain structures as the rest of brain gains neurons. The three panels show the phylogenetic trees indicating in blue what we propose to be the scaling exponents that applied to ancestral mammals determining the rate at which each structure gains neurons as the rest of brain also gains neurons, and that still apply to some modern clades. The different colors show the clade-specific changes in the respective exponents. n.s., exponent is non-significant. Notice that both artiodactyls and primates exhibit a change in rate over the ancestral scaling that is however coordinated across cerebral cortex and cerebellum. (B) Scaling of estimated average neuronal cell mass in the different brain structures as each structure gains neurons. The four panels show the phylogenetic trees indicating in blue what we propose to be the scaling exponents that applied to ancestral mammals determining the rate at which neurons in each structure increase in size (mass) as the structure gains neurons, that still apply to some modern clades, and in different colors the exponents that apply to divergent clades. The asterisk for the artiodactyl olfactory bulb indicates that although there is still no significant scaling in the structure, as in the putative ancestral scaling rules, average neuronal cell mass is inferred to have undergone a step increase relative to the ancestral condition.

