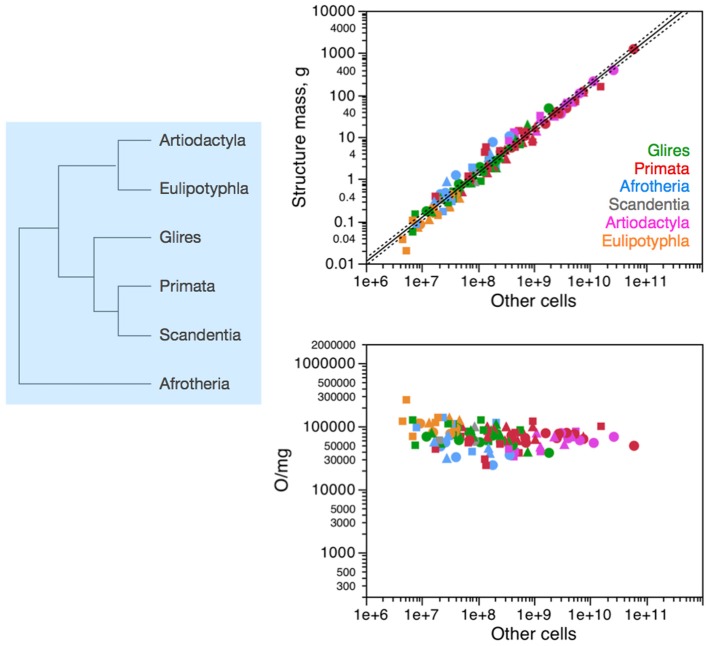
Figure 2.
Non-neuronal scaling rules for the different brain structures, that is, the relationship between structure mass and number of non-neuronal (other) cells, is shared across the 41 species in 6 mammalian clades, and thus presumably applied in the evolutionary history of these clades since their common ancestor. Top right: scaling of brain structure mass as a function of numbers of non-neuronal (other) cells in the structure, with a common exponent of 1.020 ± 0.026, p < 0.0001, plotted along with the 95% confidence interval (dashed lines). Bottom right: variation in other (non-neuronal) cell density plotted as a function of numbers of other cells in the structure, showing no significant correlation across the parameters. Each symbol represents the average values for one brain structure (cerebral cortex, circles; cerebellum, squares; rest of brain, triangles) in one species (afrotherians, blue; glires, green; eulipotyphlans, orange; primates, red; scandentia, gray; artiodactyls, pink). The phylogenetic scheme on the left indicates the clades that share the same non-neuronal scaling rules, and the presumed extension of these shared scaling rules to the common ancestor to the 6 clades.

