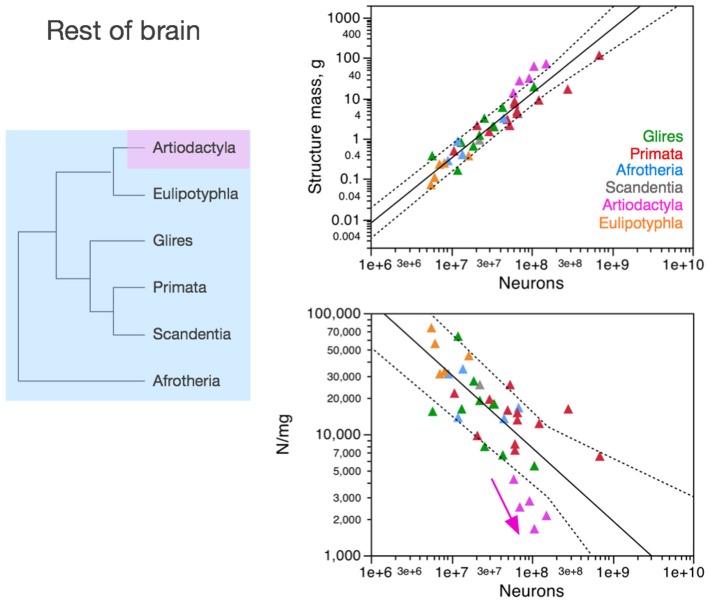
Figure 5.
Neuronal scaling rules for the rest of brain, that is, the relationship between rest of brain mass and number of neuronal cells, differs between artiodactyls and other clades, but is shared across all non-artiodactyl species examined. Top right: scaling of rest of brain mass as a function of numbers of neurons in the structure across species. Plotted power function applies to all non-artiodactyls, with an exponent of 1.400 ± 0.077, p < 0.0001. Bottom right: scaling of neuronal density in the rest of brain as a function of numbers of neurons in the structure. Plotted power function applies to all non-artiodactyls, with exponent −0.398 ± 0.079, p < 0.0001. Notice that neuronal density decreases uniformly across species as the cerebral cortex gains neurons, but decreases even more steeply in artiodactyls (pink arrow), which we suggest that branched off the mammalian ancestor (to which the same rules shared by current non-artiodactyls applied) when a modification resulted in an even faster increase in average neuronal cell size (and thus, a faster decrease in neuronal density) as the rest of brain gained neurons (pink arrow). Each symbol represents the average values for the rest of brain in one species (afrotherians, blue; glires, green; eulipotyphlans, orange; primates, red; scandentia, gray; artiodactyls, pink). The phylogenetic scheme on the left indicates in blue the clades that share the same neuronal scaling rules for the rest of brain, and the presumed extension of these shared scaling rules to the common ancestor to the non-artiodactyl clades, while artiodactyls diverge from them (pink).

