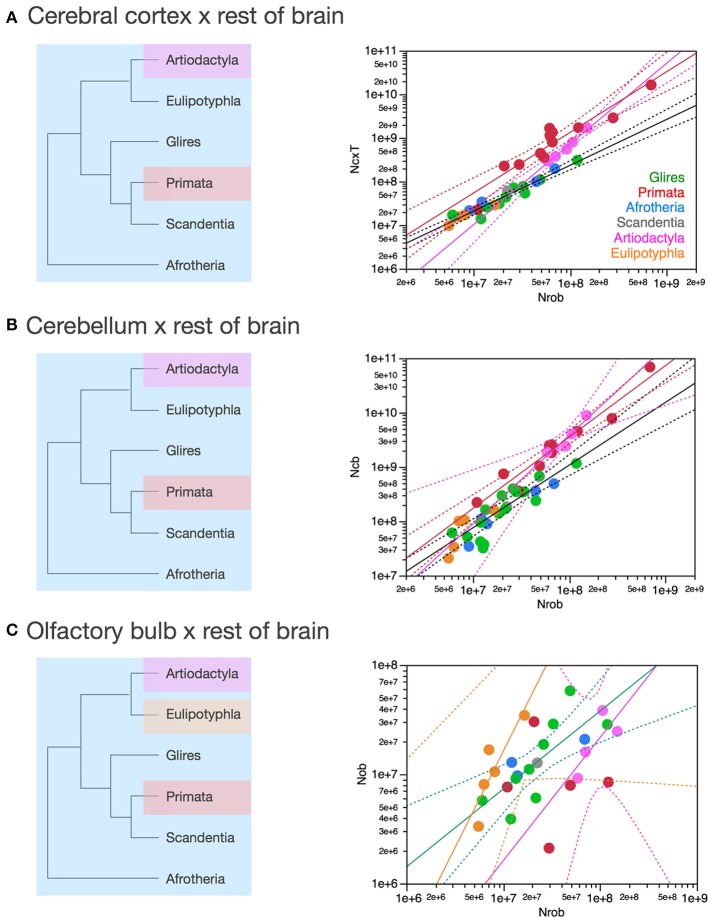
Figure 8.
Scaling of numbers of neurons in the cerebral cortex, cerebellum and olfactory bulb as a function of numbers of neurons in the rest of brain varies across clades. Each symbol represents the average values for the structures indicated in one species (afrotherians, blue; glires, green; eulipotyphlans, orange; primates, red; scandentia, gray; artiodactyls, pink). The phylogenetic scheme on the left indicates in blue the clades that share the same neuronal scaling rules for the rest of brain, and the presumed extension of these shared scaling rules to the common eutherian ancestor; clades that have divergent scaling rules are colored differently. (A) Scaling of numbers of neurons in the cerebral cortex as a function of numbers of neurons in the rest of brain across species. Power functions plotted have exponents 1.391 ± 0.158, p < 0.0001 (primates, in red), 1.852 ± 0.135, p = 0.0008 (artiodactyls, in pink), and 1.053 ± 0.061, p < 0.0001 (afrotherians, glires, scandentia and eulipotyphlans, in black). (B) Scaling of numbers of neurons in the cerebellum as a function of numbers of neurons in the rest of brain across species. Power functions plotted have exponents 1.315 ± 0.112, p < 0.0001 (primates, in red), 1.632 ± 0.222, p = 0.0148 (artiodactyls, in pink), and 1.154 ± 0.112, p < 0.0001 (afrotherians, glires, scandentia and eulipotyphlans, in black). (C) Scaling of numbers of neurons in the olfactory bulb as a function of numbers of neurons in the rest of brain across species. Power functions plotted have exponents 1.770 ± 0.578, p = 0.0548 (eulipotyphlans, in orange), 1.127 ± 0.638, p = 0.2194 (artiodactyls, in pink), and 0.714 ± 0.181, p = 0.0023 (afrotherians, glires, and scandentia, in black).

