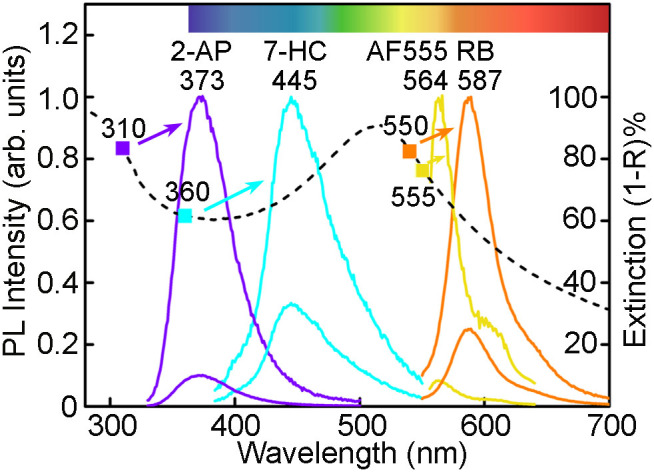
Figure 1. Normalized fluorescence emission spectra acquired from the bimetallic film (upper) and quartz (lower).

The bimetallic films are prepared by silver implantation (20 kV, 5 × 1016 cm−2). The dashed line shows the extinction spectrum of the bimetallic film and the excitation wavelengths for different fluorescence molecules are shown. The number on top of each curve shows the peak wavelength of the fluorescence emission spectrum. The enhancement factors are about 10, 3, 11, and 4 for 2-AP, 7-HC, AF555, and RB molecules.
