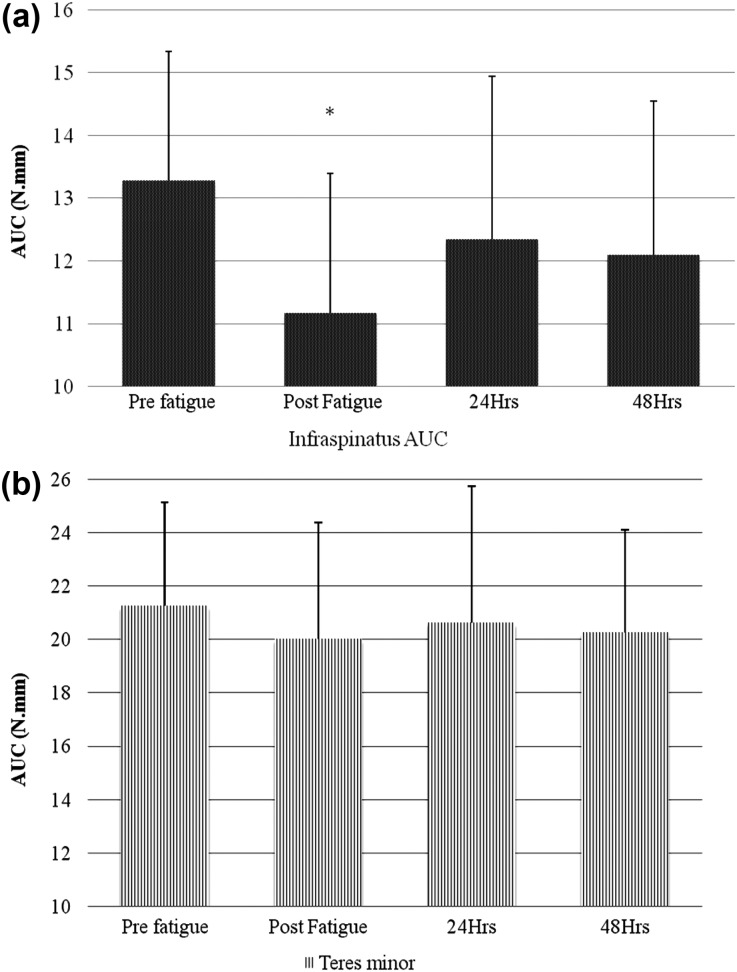
Figure 2.
Area under the curve (AUC) of a) Infraspinatus; and b) Teres minor. Y‐axis‐ area under the curve (in N.mm), X‐Axis‐ time points at which the stiffness was measured. * indicates statistically significant infraspinatus AUC reduction immediately after the external rotator fatigue. Error bars represent standard deviations.

