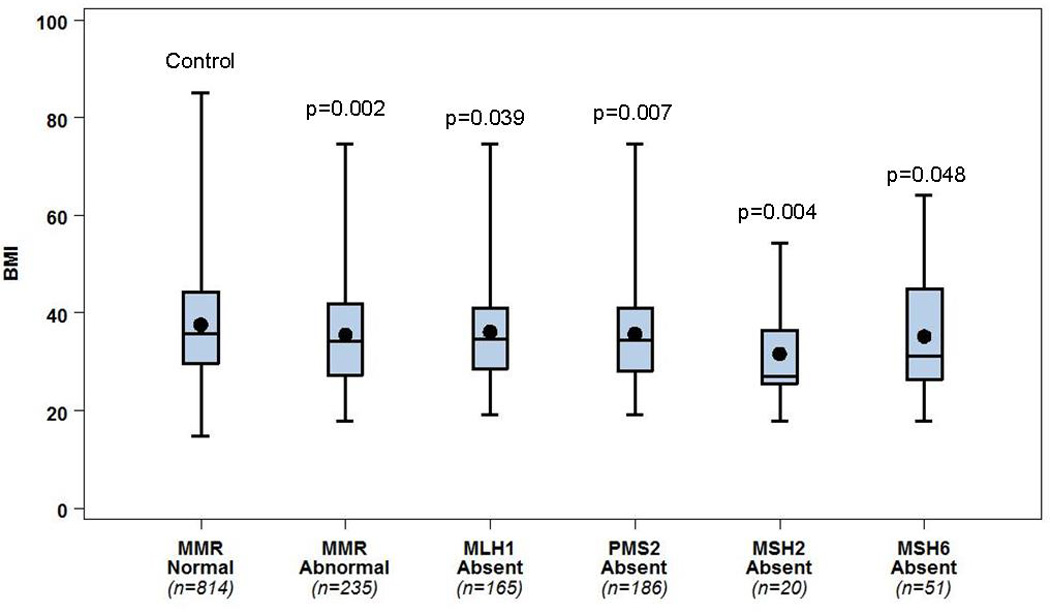
Figure 1.

BMI data stratified by MMR protein absence (any protein absent, and individual MLH1, PMS2, MSH2, or MSH6 absent), compared to a control group of women with all MMR proteins present. Comparison demonstrates that women with EC MMR intact have a higher BMI than those with any abnormal MMR protein (p=0.002). This largely holds true when stratified by the individual abnormal protein lost (remaining comparisons).
Boxes: 25–75th percentile; whiskers: range; central line: mean; central dot: median.
