Figure 2.
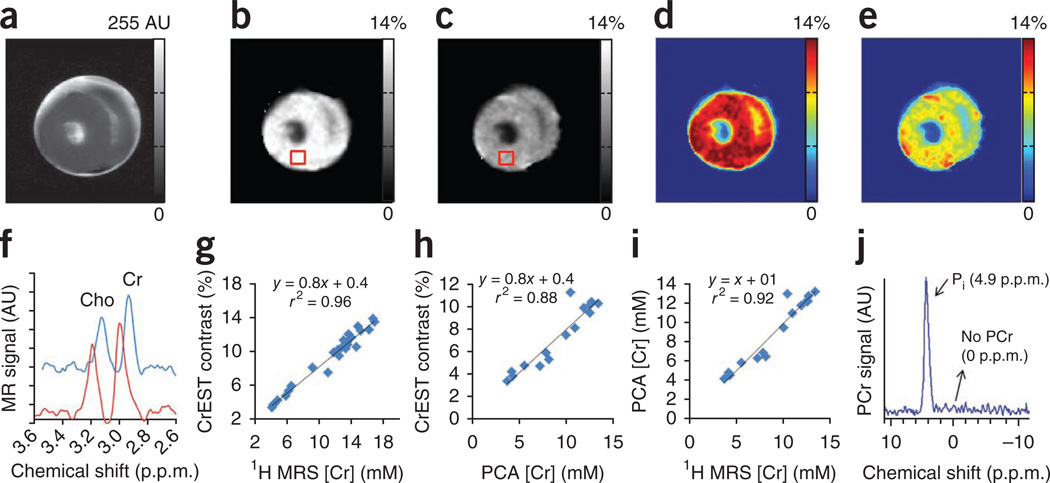
CrEST map of a noninfarcted ex vivo lamb myocardium measured at two separate time points (14 h and 62 h) following excision of the heart. (a–e) Anatomical CEST-weighted image at 2 p.p.m. (a) and gray (b and c) and color-coded CrEST maps (d and e) are shown. The square boxes show the representative ROIs from where the water-suppressed 1H MRS was measured. (f) 1H MRS from the ROIs shown in b and c. Clear change in the Cr resonance amplitude measured at two different time points is evident. (g) Plot showing a linear correlation between Cr concentration and CrEST contrast (%). The ex vivo myocardial tissue exhibits 0.8% CrEST contrast per 1 mM Cr. (h,i) Correlations of Cr concentration, measured through PCA extraction, with both CrEST contrast (h) and 1H MRS–measured Cr concentration (i) are shown. (j) On 31P MRS of ex vivo myocardium, only Pi resonance is visible. The scale bars shown for anatomical images are MR image intensities in AU and the scale bars for all CrEST maps are CrEST contrasts in % units.

