Figure 3.
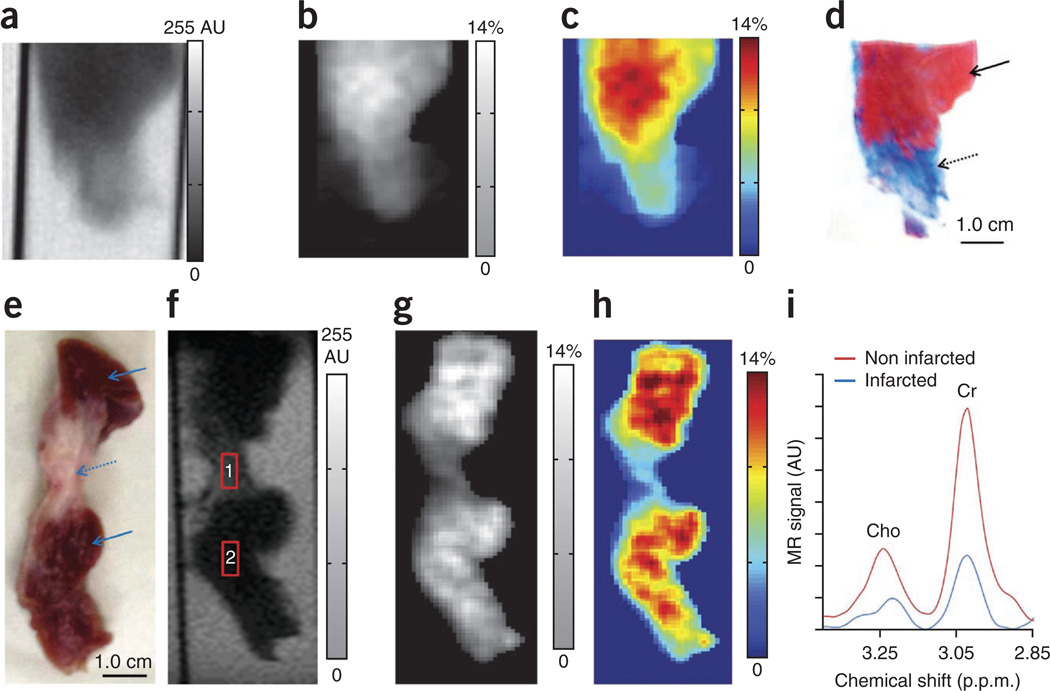
Ex vivo CrEST of noninfarcted and infarcted myocardial tissue from swine. (a) Anatomical CEST-weighted image (2 p.p.m.) of an ex vivo myocardium tissue. (b,c) The CrEST contrast (%) shown in noninfarcted and infarcted regions in gray (b) and color-coded (c) CEST maps. (d) The trichrome stain of same tissue shows the infarcted region as blue (dotted arrow) and the noninfarcted region as red (solid arrow). The CrEST from the remote region is ~10.4%, whereas from the infarcted region it is ~4.7%. (e) Digital photograph of another myocardial tissue clearly depicts the infarcted (dotted arrow) and noninfarcted regions (solid arrow). (f) Anatomical CEST-weighted image (2 p.p.m.) of the tissue from e with the voxels placed on infarcted (1) and noninfarcted regions (2). (g–i) Grayscale (g) and color-coded (h) CrEST maps show CrEST contrast in noninfarcted and infarcted regions, and 1HMRS (i) shows Cr resonance in noninfarcted and infarcted regions. The scale bars shown for anatomical images are MR image intensities in AU and the scale bars for all CrEST maps are CrEST contrasts in % units.

