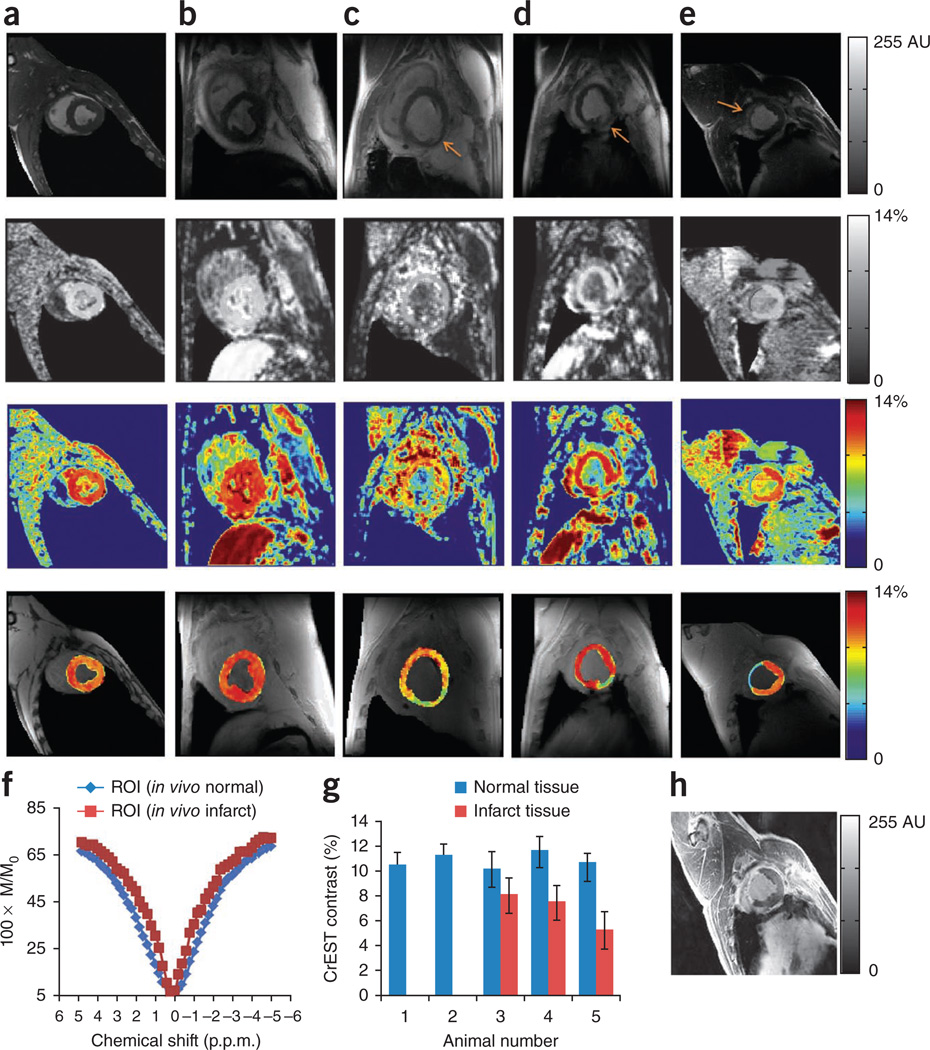
Figure 4.
In vivo CrEST data from normal and infarcted swine or sheep myocardium. (a–e) CrEST mapping of myocardium of two normal animals (swine, a,b) and three infarcted animals including two sheep (c,d) and one swine (e). The four rows show, from top to bottom, the anatomical CEST-weighted (2 p.p.m.) short-axis images of left ventricle, grayscale CrEST maps, color-coded CrEST maps and overlaid color-coded CrEST maps from all five animals. c and d show a 1-week infarction and e shows an 8-week infarction (arrows show the infarcted regions of the tissue). The process of identifying the wall is described in Supplementary Methods. (f) The fitted Z spectra from normal and infarcted regions are shown (M and M0 are water signal intensities with and without saturation, respectively). (g) Bar graph showing the CrEST contrast values in normal and infarcted regions of myocardium tissue. Data are expressed as mean ± s.d. (h) Delayed gadolinium-enhanced image of the 8-week infarcted swine myocardium, which shows hyperintensity in the infarcted region. The scale bars shown for anatomical images are MR image intensities in AU and the scale bars for all CrEST maps are CrEST contrasts in % units.

