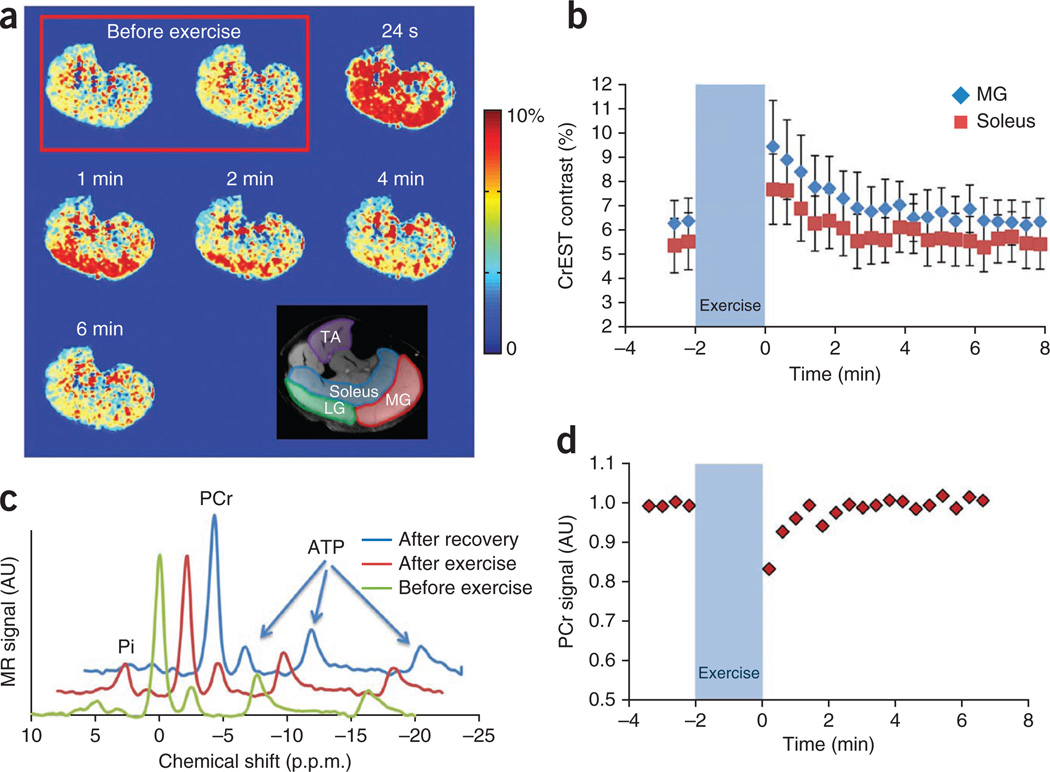
Figure 5.
CrEST maps of exercise-induced changes in skeletal muscle. (a) CrEST maps of healthy human calf before and after exercise, at different time points, show an increase in CrEST contrast immediately after exercise that corresponds to an increase in Cr concentration, followed by a return to the basal value CrEST contrast. Anatomic image of calf muscle overlaid with muscle groups highlighted is shown on the bottom right. (b) Kinetics of CrEST changes in different muscle groups depict post-exercise increases in CrEST contrast percentage and recovery to baseline levels. Data are expressed as mean ± s.d. (c) Representative 31P MRS before exercise, immediately after exercise and after full recovery from exercise. The decrease in the PCr peak and increase in Pi peak immediately after exercise is shown. (d) PCr kinetics obtained from nonlocalized 31P MRS from the same muscle region, showing a decrease in PCr signal immediately following exercise, which recovers back to baseline values. The scale bars shown for anatomical images are MR image intensities in AU and the scale bars for all CrEST maps are CrEST contrasts in % units.

