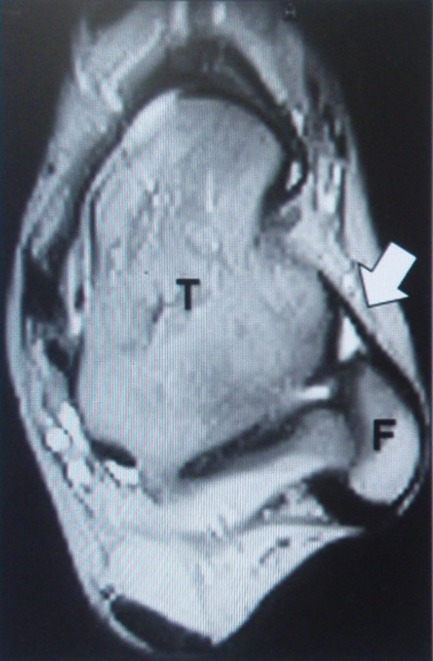
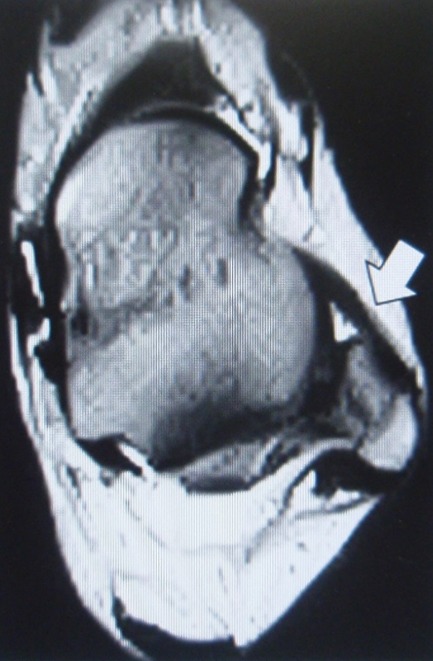
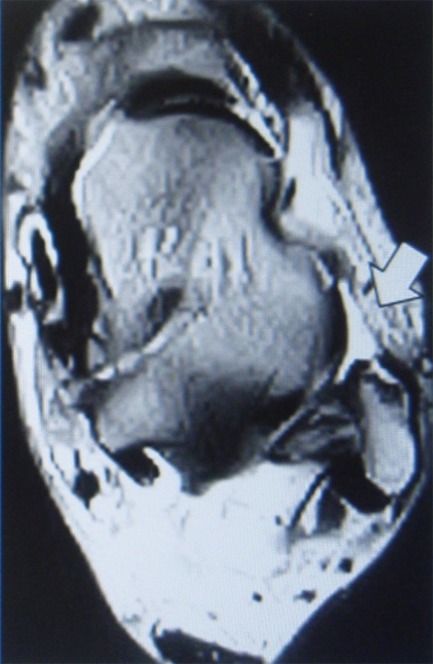
Figs. 1a - 1c.


Axial T2-weighted images showing typical ATFL findings (white arrows). T and F denote tibia and fibula, respectively, the MRI evaluation was undertaken pre-operatively, and maximum diameters of the anterior talofibular ligaments (ATFLs) were measured.
