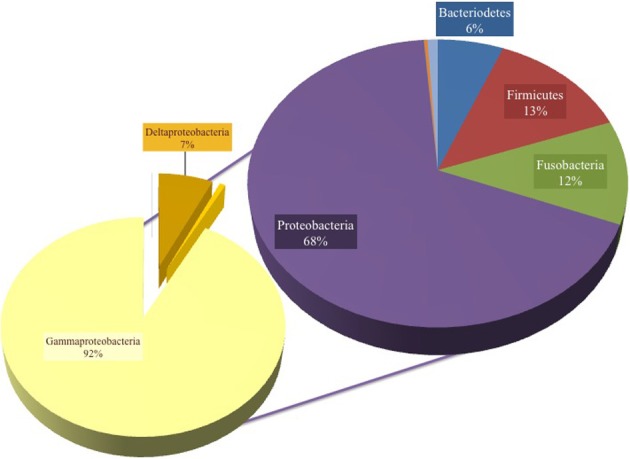
Figure 2.

Pie chart representation of the total cultured phyla in all samples, showing 68% Proteobacteria, 13% Firmicutes, 12% Fusobacteria, 6% Bacteroidetes and unknown bacteria and organism phyla (percent abundance not shown). The composition was 92% γ-proteobacteria, 7% δ-proteobacteria and the remaining Proteobacteria were assigned as ε-proteobacteria.
