
Figure 2.
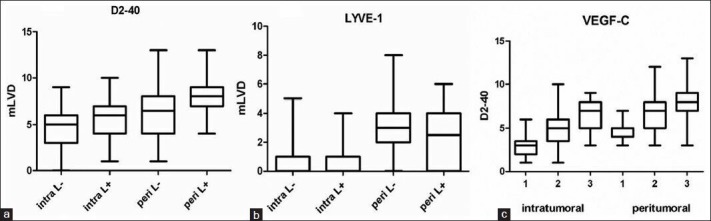
(a and b) Mean LVD in the intratumoral and peritumoral compartments of LN (-) and LN (+) tumors using D2-40 and LYVE-1, respectively. (c) Mean LVD (by D2-40) in relation to VEGF-C expression. X-axis scores: Grade groups 1, 2, and 3. All graphs: Whiskers: Minimum to maximum, line at mean