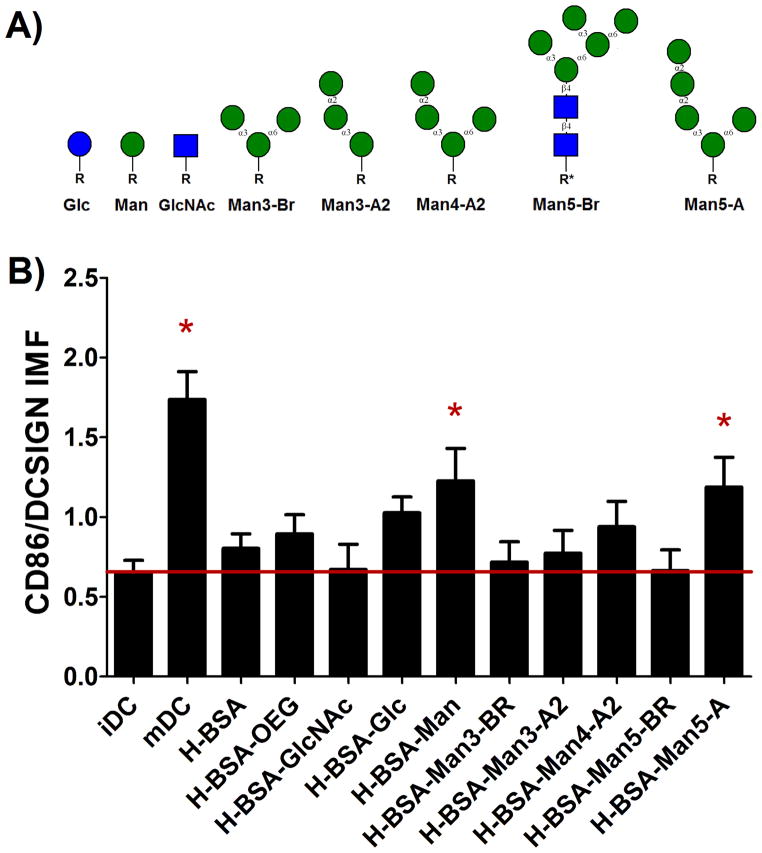
Figure 6.
Assessment of DC phenotype in response to poly-mannose structures. The structures tested can be seen in (A). Here R and R* represent the linker used for the glycan. R= (CH2CH2O)3SH and R*= AEAB-NH2C(CH2)3SH, The IMF was assessed for all adsorbed conjugates and H-BSA-Man and H-BSA-Man5-A had had a statistically increased expression over iDC (B). mDCs also showed a statistical increase in IMF. n=17 donors. Error bars represent standard error, red line indicates mean iDC response, * indicates statistical difference from iDC.

