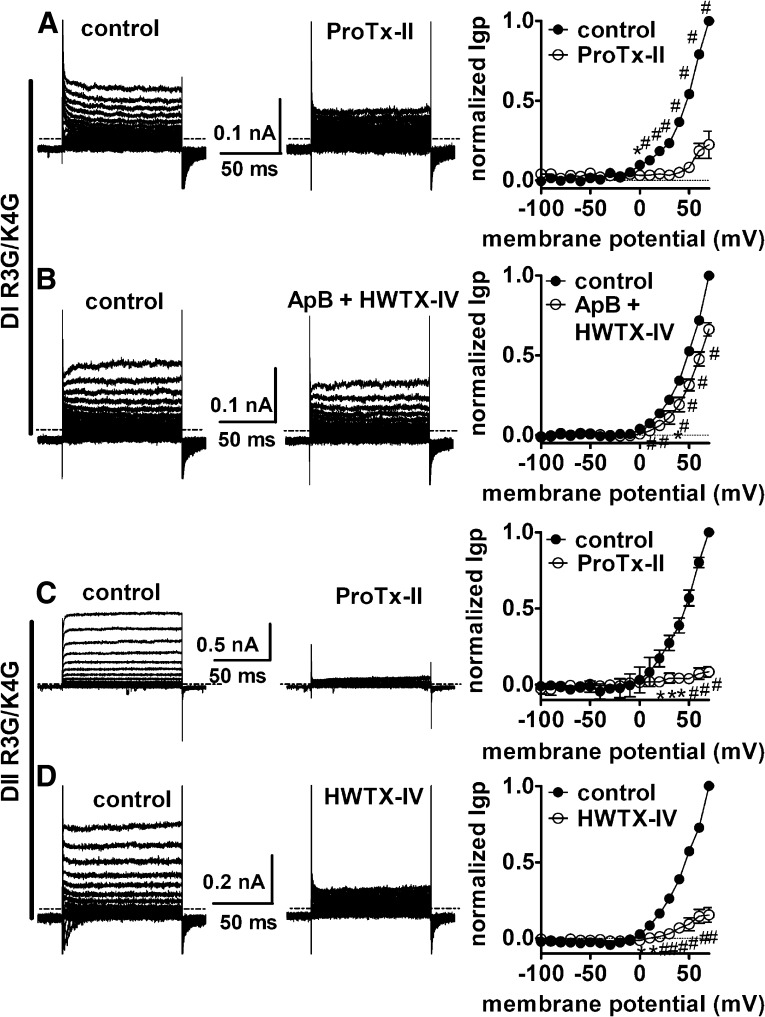
Fig. 8.
Effects of toxins on outward Igp fluxing through Nav 1.5. Typical outward Igp current traces and associated I–V curves before and after toxin treatment are shown. (A) Effect of ProTx-II on DI outward Igp. (B) Effect of the mixture of ApB (100 nM) and HWTX-IV (1 μM) on DI outward Igp. (C) Effect of ProTx-II on DII outward Igp. (D) Effect of HWTX-IV on DII outward Igp. All currents before (left) and after (right) toxin treatment were elicited by 100-ms depolarizing steps to various potentials that ranged from –100 to +70 mV. No subtraction of linear leak and capacitance currents was performed for current traces. The dotted line across current traces represents the zero current level. Cells were pretreated with 1 μM TTX to completely block the central-pore current and held at –100 mV. Note that in the I–V curves, linear leak currents have been subtracted. *P < 0.05; #< 0.01.

