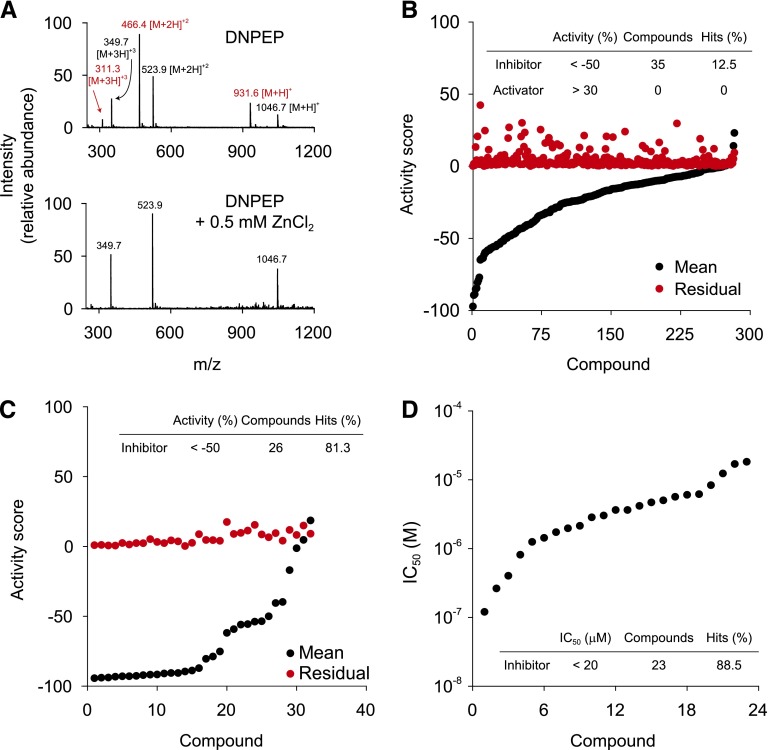
Fig. 3.
Quantification of product of Ang II hydrolysis by LC-MS–based orthogonal assay. (A) Mass spectra of peptides present in the reaction mixtures after the 30-minute incubation. Two sets of +1, +2, and +3 ions present in the top panel correspond to Ang II (substrate, labeled black) and Ang III (cleavage product, marked in red). Production of Ang III was completely abolished in a sample treated with 0.5 mM ZnCl2 (bottom spectrum). (B) The sorted activity plot of 284 hits (282 inhibitors and 2 activators) identified in the primary HTS and retested by the Ang II hydrolysis assay at 10 µM in triplicate. Results are summarized in the inset table. (C) The repeat of Ang II hydrolysis assay to confirmed hits (32 available of 35 total) selected from triplicate screen shown in (B) by one-plate experiment, at 10 µM in triplicate. Results are summarized in the inset table. (D) The sorted IC50 plot for 23 of the most potent inhibitors. Each compound was tested at 10 different doses. Curve fitting was performed using the Hill equation.

