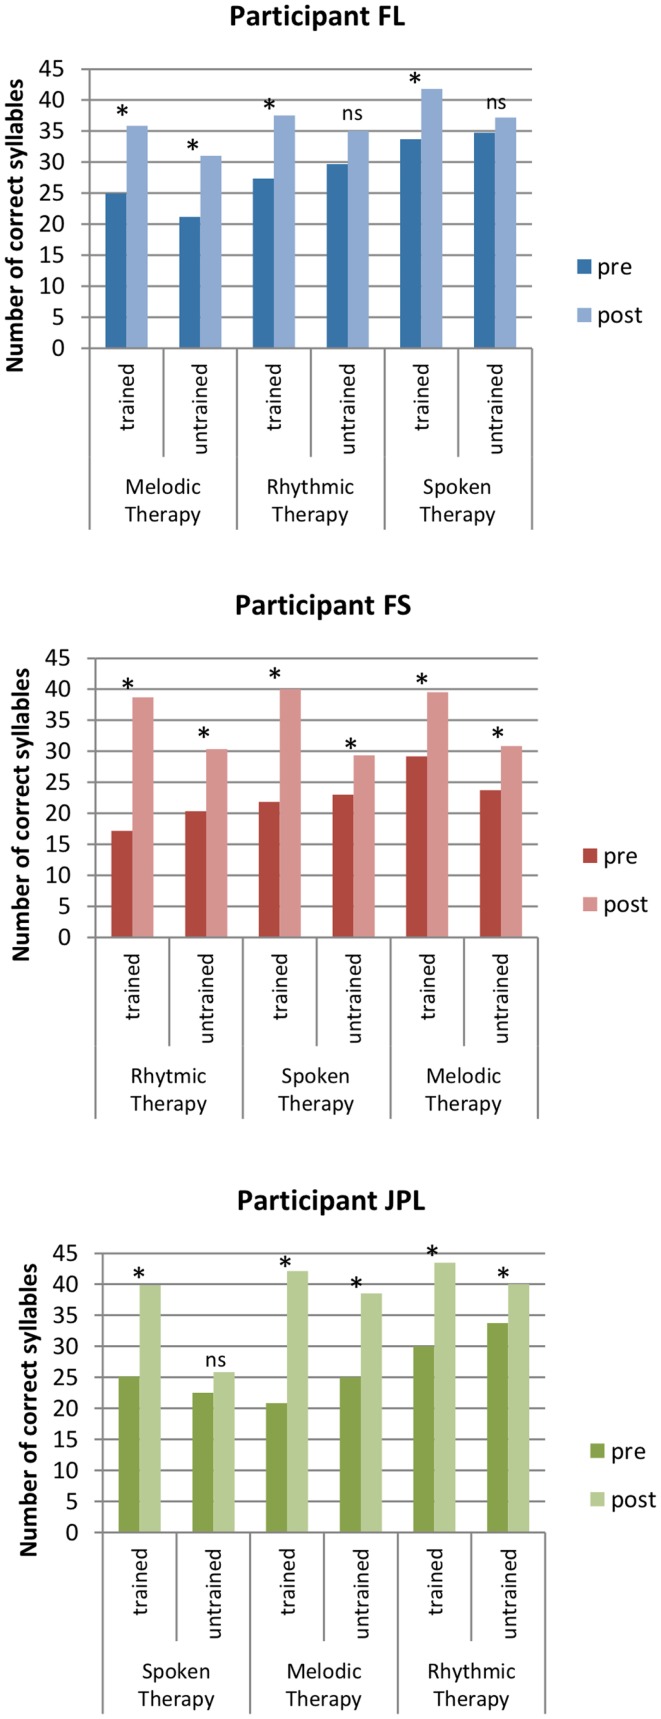
Figure 3.
Speech accuracy in trained and non-trained Test-phrases before and after each treatment (i.e., direct and indirect effects). Columns represent the total number of correct syllables in 10 phrases produced in a normally spoken repetition task. The star indicate pre–post-treatment differences in non-parametric statistical tests whenp < 0.05.

