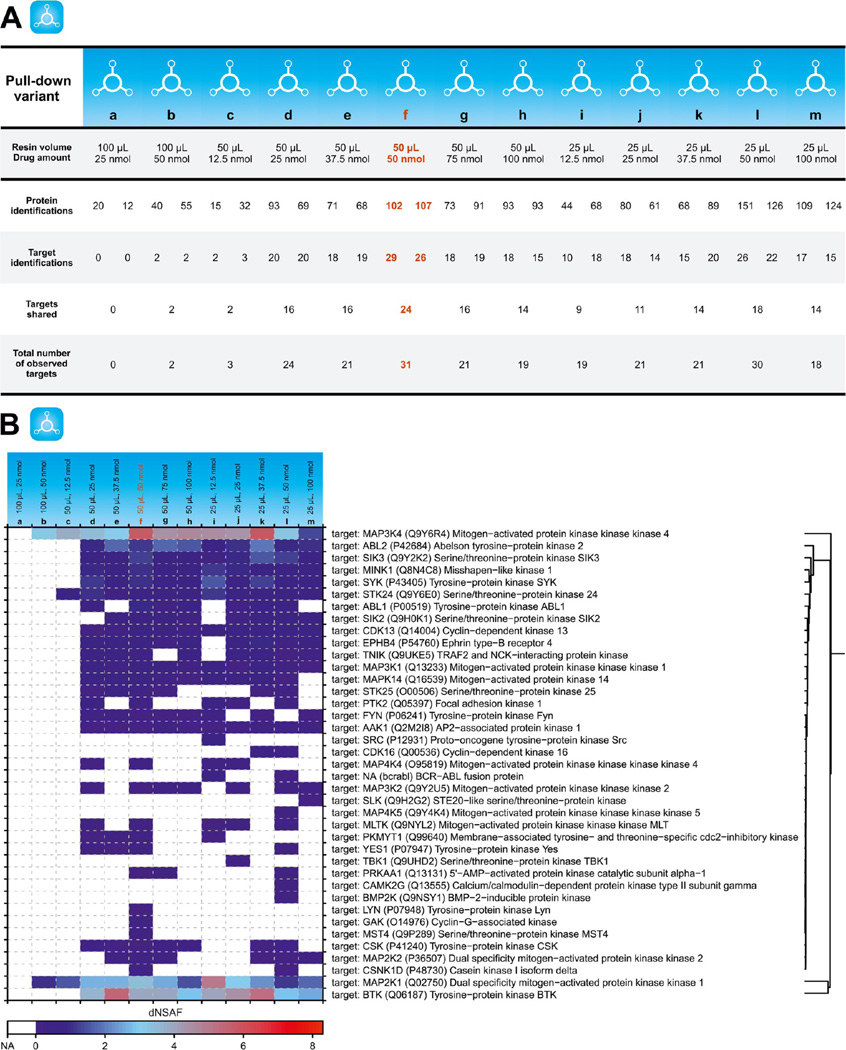
Figure 4.
Affinity resin effects. (A) Summary statistics of pull-down experiments investigating thirteen different affinity resin designs. The table shows protein and target identifications for both replicates performed per pull-down variant. (B) Heat map showing relative quantities of all targets identified for each pull-down. Presented dNSAF values are calculated means of the original dNSAFs obtained from relevant duplicate pull-downs. The most efficient pull-down variant is highlighted in red.

