
Fig. 3. Residue substitutions within the Spx α6 helix significantly affect YjbH interaction with Spx.
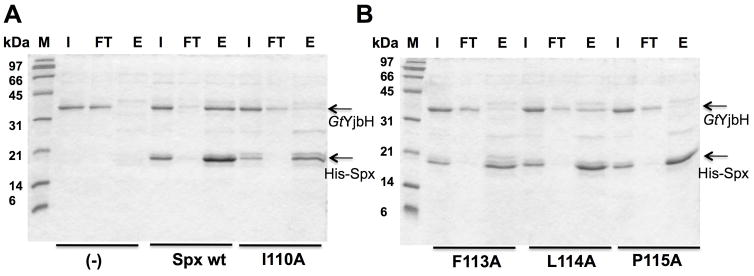


A and B. SDS- PAGE shows in vitro Ni affinity pull-down experiments to detect interaction between GtYjbH and His6-Spx mutants (I110A, F113A, L114A, P115A). M, marker; FT, flow-through; E, elution.
C. A bar graph shows the level of interaction between Spx mutants and GtYjbH. Values are based on band intensity on the gel lanes into which the elution fractions were applied, and is the ratio of Spx:GtYjbH band intensities. The wild-type Spx:GtYjbH band intensity being 100%.
D. SDS-PAGE shows the analyses of peak elution profiles from GtYjbH-His6/Spx (WT, F113A, L114A, and P115A) complex purification using size exclusion column chromatography (Bio-gel P100, BioRad). Using protein standard in gel filtration, 43 kDa (Ovalbumin) eluted in 190 min and 13.7 kDa (Ribonuclease A) in 330 min; Peak1 eluted in 200 min (GtYjbH-His/Spx, 50 kDa) and Peak 2 in 340 min (Spx, 15.5 kDa).