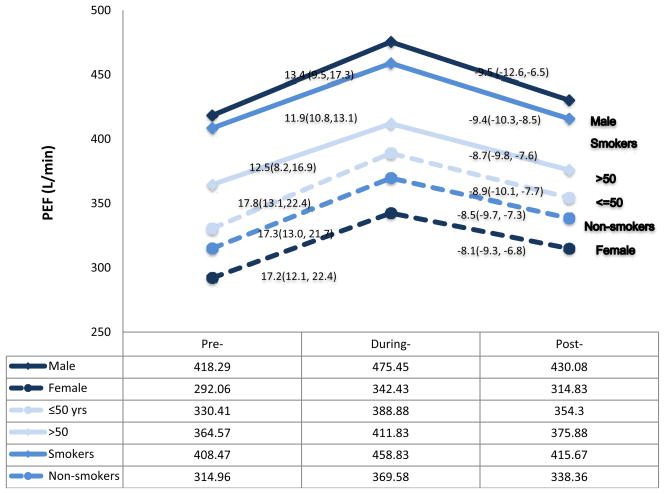
Figure 1. PEF Changes over the Course of the Olympics among Different Groups.
PEF changes in subgroups. The percentage changes of PEF levels over the three time periods were compared among six subgroups in the figure. X-axis: Three time periods. Y-axis: PEF levels (L/min). “lines in different color and styles” represents different subgroups.

