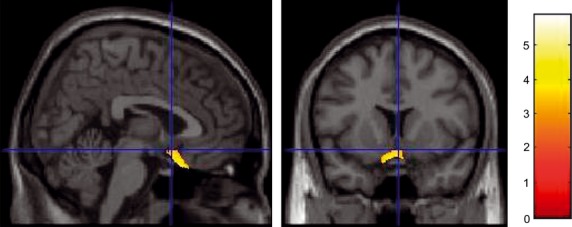
Figure 5.

Another area (the left subgenual anterior cingulate cortex) showing an increase in the regional gray matter volume in the BF group. Results are shown for P = 0.0001 corrected for visualization purposes. Note that the cluster may look small compared with the extent of the significant correlation described in the Results section because of the thresholds used in the SVC.
