
Figure 7.
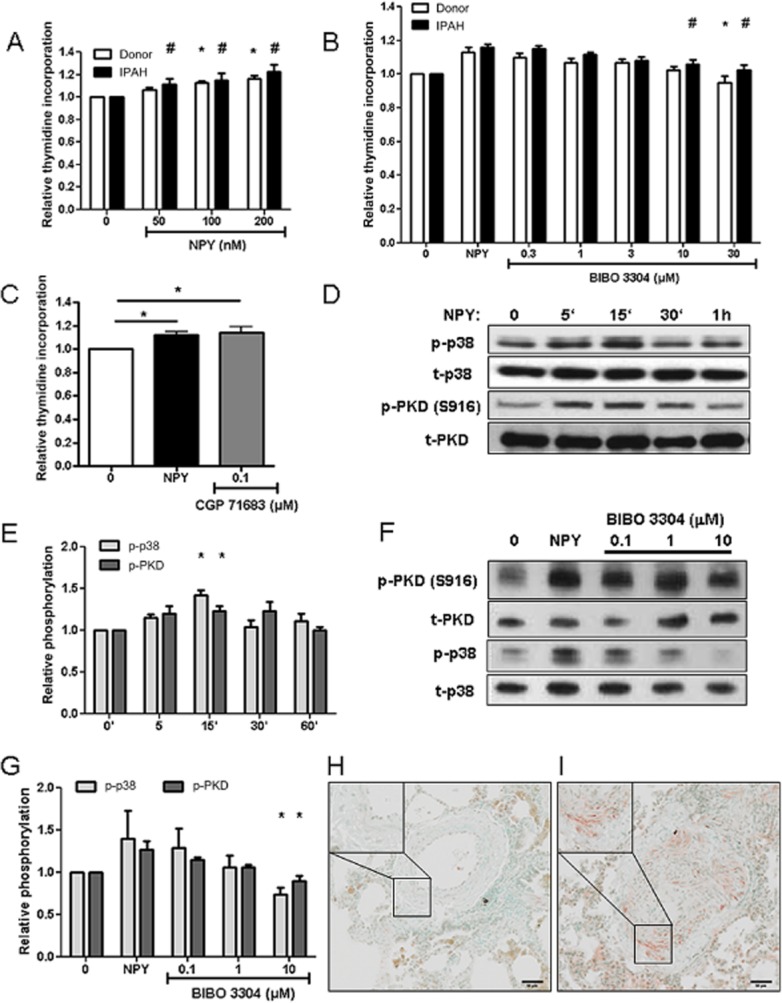
NPY stimulation activated PKD and p38 signalling pathways and increased hPASMC proliferation. (A) Donor and IPAH hPASMC (n ≥ 11 independent experiments) were stimulated with the indicated concentrations of NPY. Graph represents the amount of 3H-labelled thymidine incorporation as an index of cell proliferation. Serum-starved hPASMC were pretreated for 1 h with indicated concentrations of BIBO 3304 (B, n ≥ 9 independent experiments) or CGP 71683 (C, n ≥ 7 independent experiments) inhibitors, followed by overnight incubation with 200 nM NPY. (D) Representative western blot image of phosphorylation of PKD, at serine S916 position and p38 kinase. Human PASMC were serum-starved and stimulated with 200 nM NPY for indicated time. Determination of total PKD and p38 protein levels served as corresponding loading control. (E) Quantification of (D) (n ≥ 5 independent experiments). (F) Representative western blot image of PKD and p38 phosphorylation after 10 min 200 nM NPY stimulation and pretreatment with indicated BIBO 3304 concentrations. (G) Quantification of (F) (n ≥ 7 independent experiments). Representative images of immunohistochemical staining of human pulmonary artery from donor (H) and IPAH patients (I) against phosphoPKD (n = 5 for each group). * or # (in the case of IPAH PASMC) denotes P < 0.05.