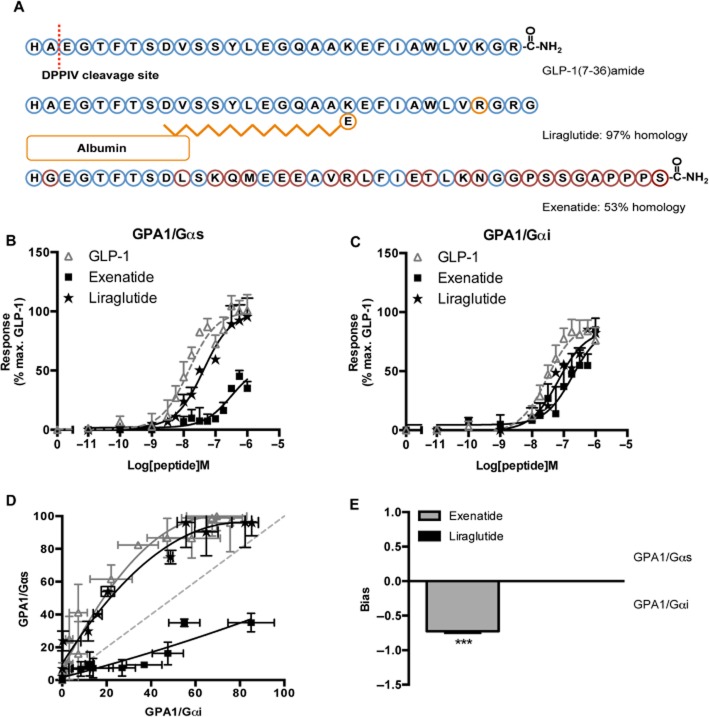
Figure 7.
The influence of G protein subtype on GLP-1 receptor activation by peptide drugs used in the treatment of type 2 diabetes. (A) Sequence homology of GLP-1 mimetics. Blue circles are conserved throughout all three peptides, orange circles are unique to liraglutide and red denotes exenatide residues. The DPP-IV cleavage site is indicated by the dashed line. (B, C) Concentration-response curves were constructed to each of the GLP-1 receptor agonists in the indicated yeast strains. Each strain was assayed for reporter gene activity following incubation with a range of ligand concentrations for 20 h. Data are presented as the % maximal response achieved by GLP-1 at the GPA1/Gαs chimera strain. (D) Equimolar bias comparison generated by plotting the normalized responses at each G protein chimera for equivalent concentrations of ligand. Dashed line represents no bias. (E) The signalling bias was determined for each drug relative to the natural agonist using the change in log(τ/KA) ratio for the data in (B) and (C). Statistical significance was determined using one-way anova with Bonferroni's post-test with each data set compared with GLP-1 (***P < 0.001). All data are mean of 5–8 independent experiments ± SEM.

