
Figure 8.
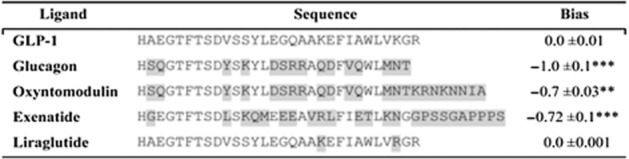
Comparison of GLP-1 receptor peptide ligands and relative bias factors. Sequences of the various peptide ligands for the GLP-1 receptor aligned to the potent, natural agonist. Amino acids differing from those in GLP-1 are highlighted in grey. The relative (to GLP-1) bias factor was quantified for each ligand as the change in log(τ/KA) ratio where a negative value indicates preference for the inhibitory, Gαi chimera. Statistical significance was determined using one-way anova with Bonferroni's post-test with each data set compared with GLP-1 (**P < 0.01, ***P < 0.001). Data are mean of 5–8 independent experiments ± SEM.