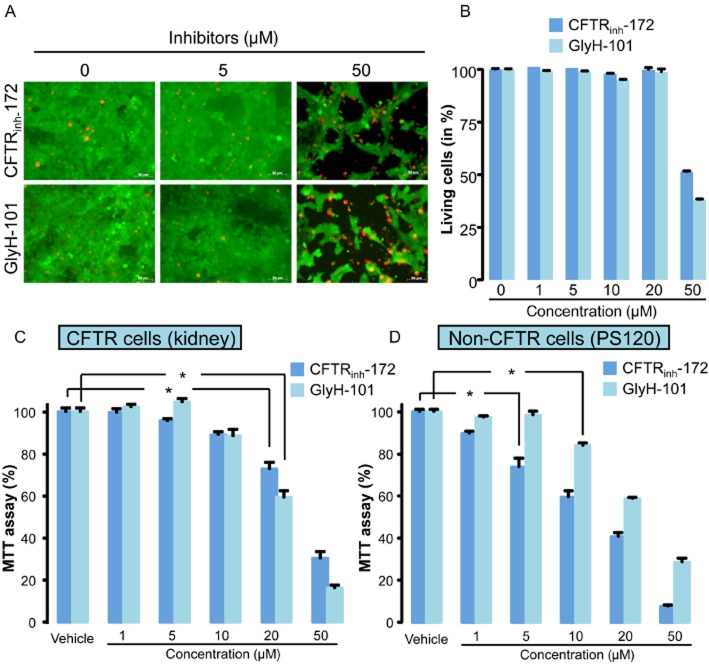
Figure 1.
Effect of CFTRinh-172 and GlyH-101 inhibitors on cellular toxicity. (A and B). Representative fluorescent dye staining (A) and related quantification of cell death (B) in CFTR-expressing cells (confluent kidney PCT cell monolayers) exposed for 24 h to increasing concentrations of CFTRinh-172 or GlyH-101 (concentrations ranging from 0.5 to 50 µM). Live cells labelled with calcein-AM appeared green while dead cells labelled with homodimeric propidium iodide appeared red. Scale bars represents 80 µm. Values were normalized to the 100% of live cells in control experiments and were means (±SEM) of three to six individual experiments. (C) MTT assay performed on CFTR-expressing cells (kidney PCT cells) exposed as in (A) to increasing concentrations of both CFTR inhibitors. Values were normalized to control experiments and represent means (±SEM) of eight individual experiments. (D) MTT assay performed on non–CFTR-expressing cells (PS120) exposed to increasing concentrations of both inhibitors. Values were normalized to vehicle experiments and represent means (SEM) of eight individual experiments. *P < 0.05, Tukey's HSD test.

