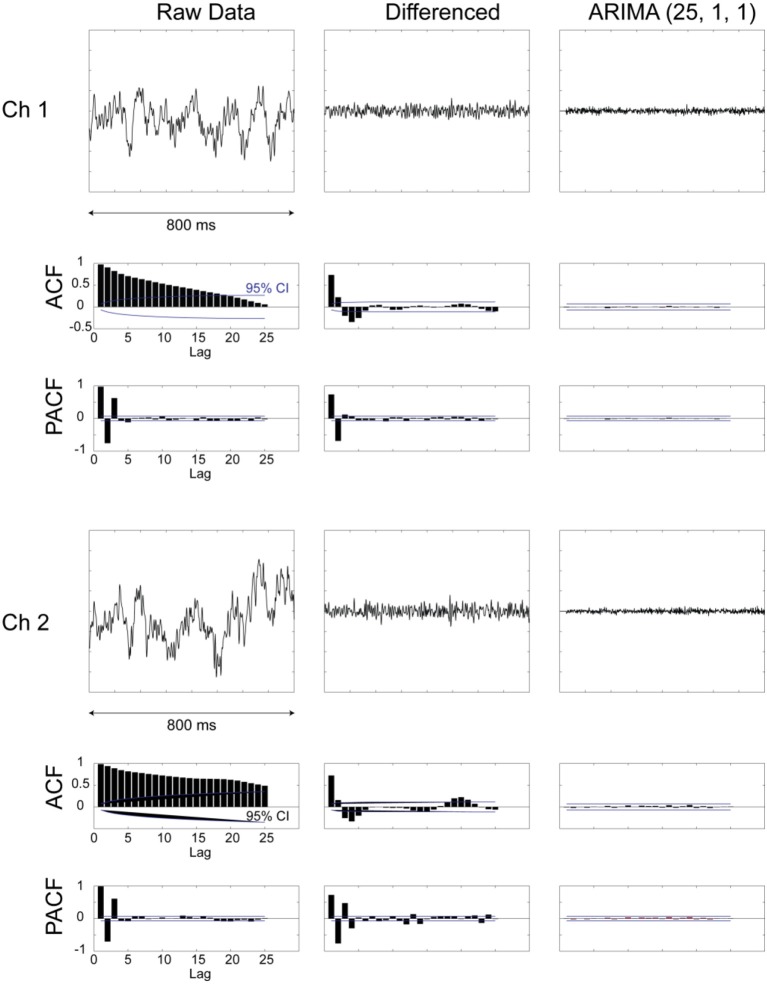
Figure 3.
Examples from two LPF recordings and their preprocessing for prewhitening. Plots are shown for raw data, data after first-order differencing, and after applying an ARIMA [25,1,1] model. In addition, plots of autocorrelation function (ACF) and partial autocorrelation function (PACF) are shown for the different stages of data processing. It can be seen that the prewhitened data (right-most column) are devoid of any internal dependencies and evidenced by the flat ACF and PACF plots.

