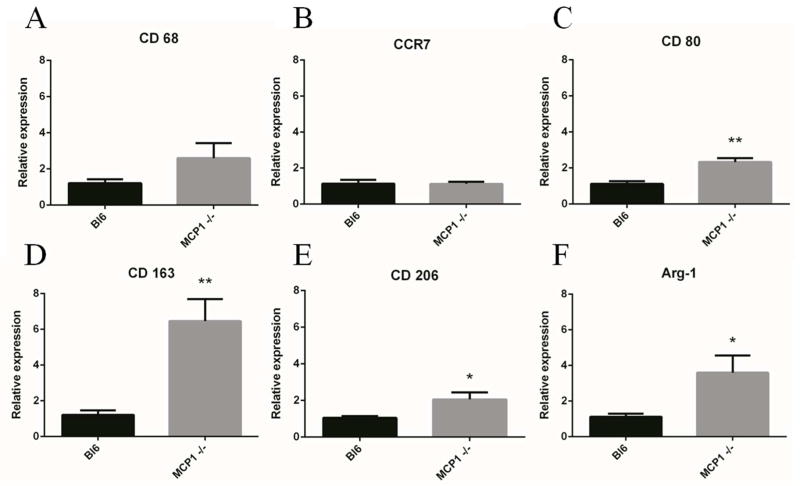
Figure 3.
KO macrophages were shifted towards an M2 phenotype at 2 wks. Quantitative real-time PCR was used to measure markers for macrophage polarization. WT and KO macrophages showed similar levels of CD 68 (A, pan macrophage) and CCR7 (B, M1). The M1 marker CD 80 (C) was elevated in KO mice. The M2 markers CD 163 (D), CD 206 (E), and Arg-1(F) were all elevated in KO mice, which indicated a phenotype shift at two weeks. * indicates p < 0.05 and ** indicates p < 0.01 using Student’s t test, n is 6 for each point and data is presented ± SEM.

