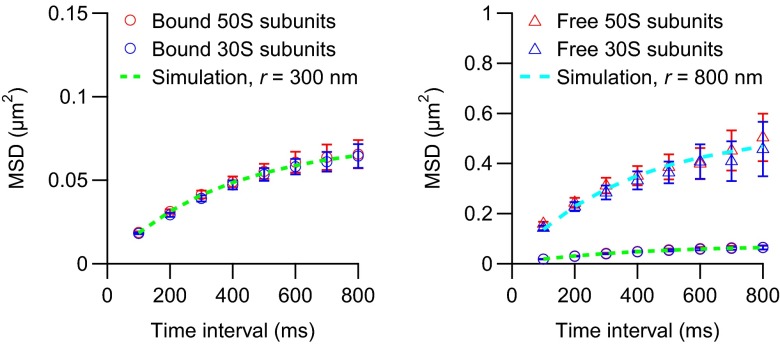
Fig. 3.
Mean square displacements of mRNA-bound (Left) and free (Right) ribosomal subunits in living E. coli cells. The cells were imaged at 10 Hz for 5 min on agarose pads with a laser excitation exposure time of 5 ms. The mean square displacements of the bound subunits are also included in the right plot as a reference. Each experimental curve corresponds to >70 trajectories from 16 cells. The simulated mean square displacements (dashed curves) were obtained by simulating 10,000 normal diffusion trajectories in a sphere with a radius of 300 (green curve) or 800 (cyan curve) nm. The diffusion coefficient was set to 0.055 (green curve) or 0.40 (cyan curve) μm2·s−1. The error bars represent SEMs.

