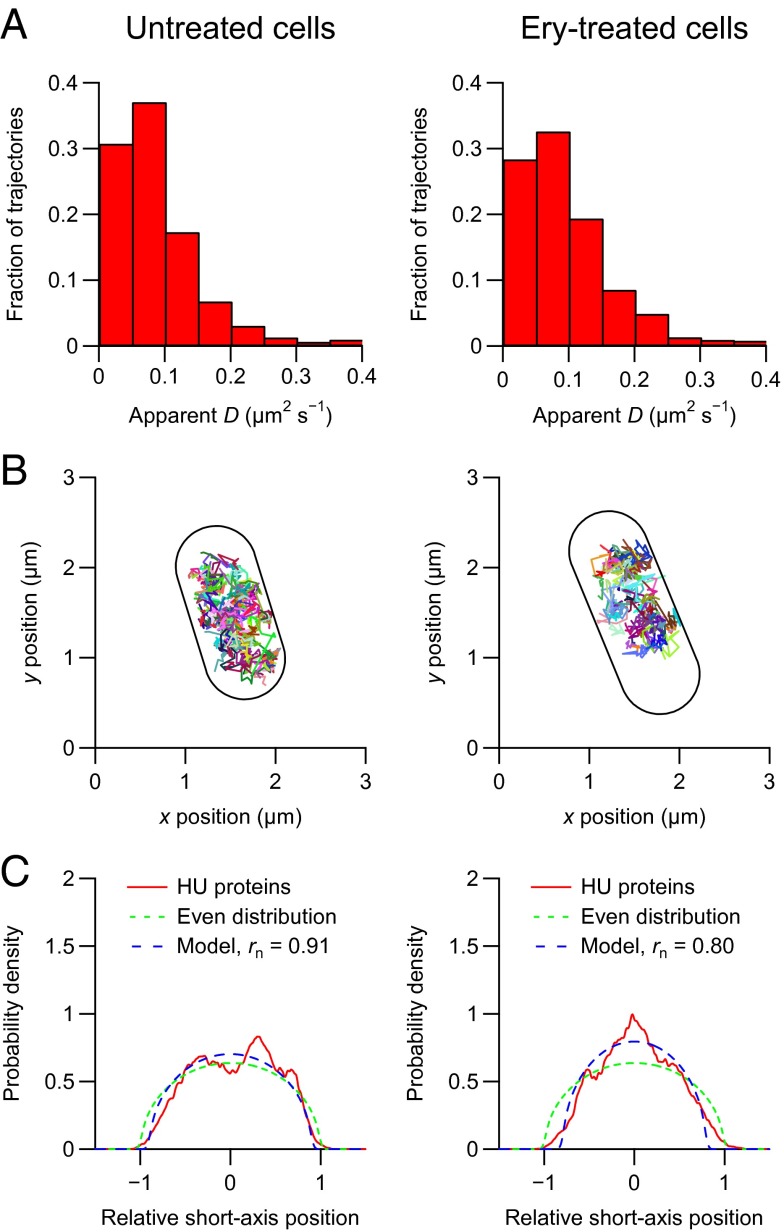
Fig. 4.
Tracking of individual HU proteins in untreated (Left) and erythromycin-treated (Right) E. coli cells. The cells were imaged at 50 Hz for 5 min on agarose pads with a laser excitation exposure time of 5 ms. The geometries of the imaged cells were determined from out-of-focus bright-field images. The lengths of the imaged cells were determined to be between 2.0 and 3.2 µm. (A) Distributions of apparent diffusion coefficients of individual HU proteins. Each distribution corresponds to >900 trajectories from eight cells. (B) Trajectories of individual HU proteins. (C) Distributions of relative short-axis positions of HU proteins in the cylindrical parts of eight cells (solid red curves) fitted with a model for nucleoid-associated particles (dashed blue curves). Each distribution corresponds to >10,000 positions. rn is the relative nucleoid radius.

