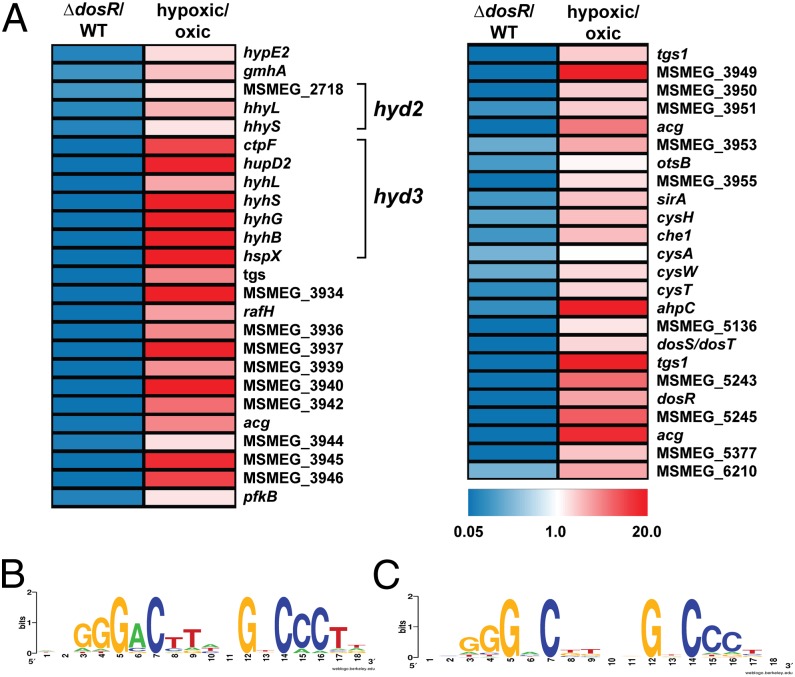
Fig. 1.
(A) Heat map of the DosR regulon of M. smegmatis. Expression ratios (fold change) are depicted for ∆dosR vs. WT (Left) and WT hypoxia vs. WT oxia (Right) (14). A tabulated DosR regulon is shown in Table S1. (B) WebLogo of 10 DosR binding sites of genes with the lowest expression ratio based on microarray analysis of ∆dosR vs. WT. (C) WebLogo of 32 genes with DosR biding sites that show significantly lower expression in ∆dosR.

