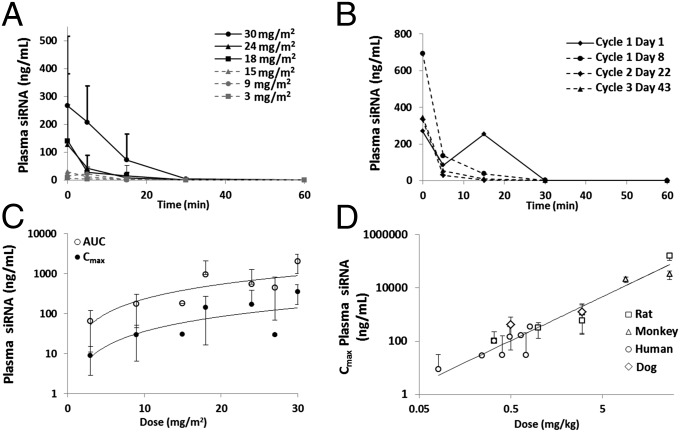
Fig. 2.
PK assessment of CALAA-01 in patients and across species. (A) Time course of average plasma concentration of the siRNA component of CALAA-01 following the end of infusion for all dosing cohorts. (B) Time course of plasma CALAA-01 siRNA following the end of infusion from cycles 1–3 of CALAA-01 from one patient who received 30 mg/m2 CALAA-01. Plasma concentration curves are similar at each cycle. Lines connecting data points are guides for the eye only. (C) AUC and Cmax relationship to dose in humans. (D) Scaling of CALAA-01 Cmax across four different species.

