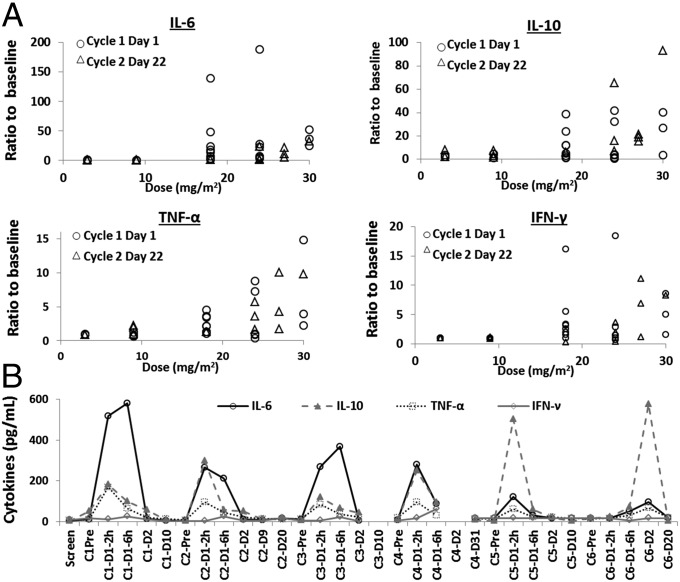
Fig. 5.
CALAA-01 treatment resulted in mild dose-dependent immunostimulation. (A) Various cytokine levels, expressed as ratio over baseline, plotted against CALAA-01 dosing level. (B) Cytokine levels over six cycles of CALAA-01 treatment at 30 mg/m2 in a single patient. Data from each cycle were collected immediately before CALAA-01 infusion and 2, 6, and 24 h post infusion. The x axis is labeled as cycle number (C#), overall time since treatment initiation (D#), and hours post infusion as appropriate.

