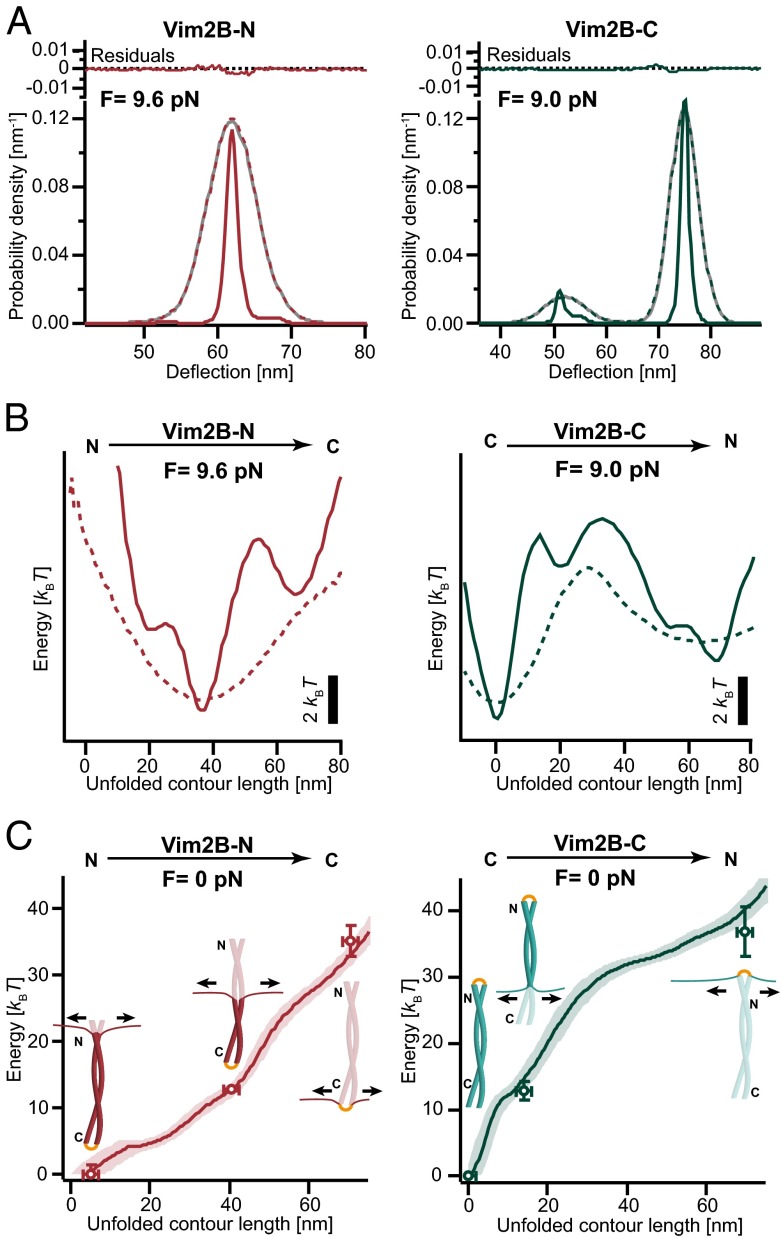
Fig. 2.
Model-free reconstruction of the full energy landscapes of Vim2B-N and Vim2B-C obtained by deconvolution. (A) The protein probability distributions of Vim2B-N (red, Left) and Vim2B-C (green, Right) may be obtained from the bead deflection probability distributions (gray) by deconvolution. The residuals show the difference between the reconvolved form of the deconvolved probability distributions (colored, dotted lines) and the measured distributions (gray line). (B) The deconvolved energy landscapes of Vim2B-N (continuous red line, Left) and Vim2B-C (continuous green line, Right) under force provide more details than the original bead position-derived landscapes (dotted lines). (C) Energy landscapes of Vim2B-N (red, Left) and Vim2B-C (green, Right) in the absence of force. Shaded areas are 68% confidence intervals obtained by bootstrapping. Points are values obtained from conventional data analysis (SI Appendix, section 4.4 and Table S1).

