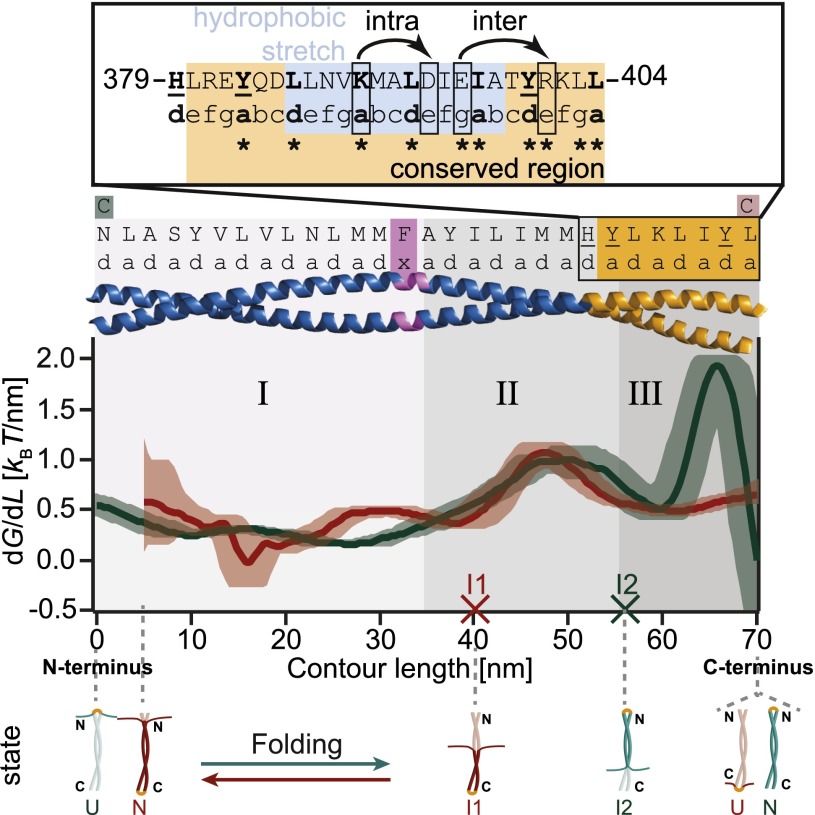
Fig. 3.
The energy profiles of Vim2B-N (red) and Vim2B-C (green) reveal a tripartite stability of the CC. Derivative of the energy landscapes of Vim2B-N (red) and Vim2B-C (green) with respect to contour length aligned at the C-terminal end. The derivatives of the energy landscape describe the energy needed to unfold a certain part of the CC and therefore may be interpreted as a local stability profile (SI Appendix). The contour lengths of the intermediates I1 and I2 obtained by conventional data analysis are indicated by red and green crosses. Shaded areas are 68% confidence intervals from bootstrapping. The first 5 nm of the stability profile of Vim2B-N are not shown, as errors exceed 100%. The residues occupying a- and d-positions of the CC are listed on top. Cysteine mutations are colored red/green according to construct. (Inset) Features of the conserved region (orange). The position of the stutter is marked in purple. The main hydrophobic stretch of coil 2B is highlighted in blue. Bulky residues causing local stability minima are underlined. Bent arrows indicate the intra- and interhelical salt bridges. Asterisks mark absolutely conserved residues that are unchanged in seven human IF proteins constituting major representatives of all five sequence homology classes of IFs (23).

