Fig. 5.
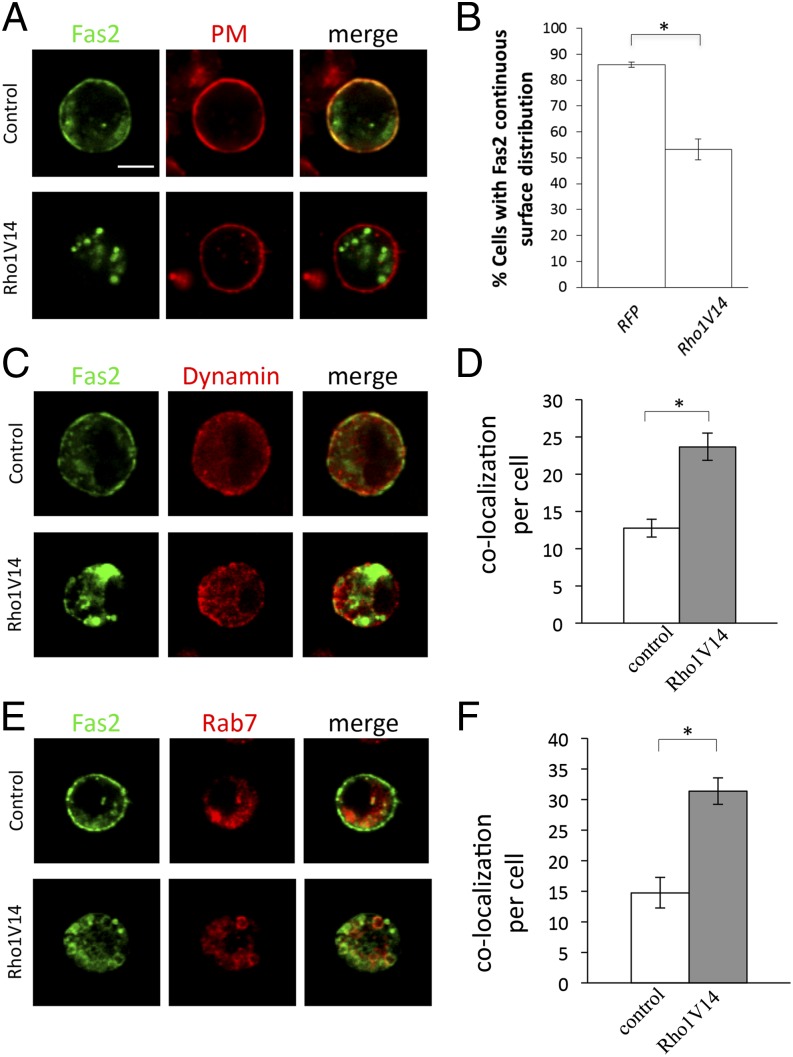
Rho1 downregulates the surface level of Fas2 in cultured cells. (A) S2 cells expressing Fas2-YFP (Upper) or both Fas2-YFP and Rho1V14 (Lower) were labeled with CellMask Plasma Membrane Stains (Life Technologies) to visualize plasma membrane (PM). Cells expressing Fas2-YFP displayed continuous cell-surface distribution of Fas2. However, many cells coexpressing Fas2-YFP and Rho1V14 showed disruptions in surface distribution of Fas2, which was coincidentally with an increase in the intracellular presence of Fas2. (B) The percentage of cells showing continuous surface distribution of Fas2 was quantified. *P = 0.0013. (C) S2 cells expressing Fas2-YFP (Upper) or both Fas2-YFP and Rho1V14 (Lower) were stained with anti-Dynamin antibody (red). Compared with that in control cells (Upper) (n = 15), the number of vesicles positive for both Fas2 (green) and Dynamin (red) were significantly increased in Rho1V14-expressing cells (n = 18). (D) The number of vesicles that were colabeled by anti-Dynamin and YFP in each cell was quantified. *P = 3.71E-05. (E) S2 cells expressing Fas2-YFP and Rab7-HA (Upper) or Fas2-YFP, Rab7-HA, and Rho1V14 (Lower) were colabeled with YFP fluorescence (green) and anti-HA (red). Compared with that in control cells (Upper) (n = 15), the number of vesicles positive for both Fas2-YFP and Rab7-HA was significantly increased in Rho1V14-expressing cells (n = 14). (F) The number of vesicles that were colabeled by Fas2-YFP and Rab7-HA in each cell was quantified. *P = 3.02E-05. (Scale bar, 5 μm.) Error bars: SEM.

