Fig. 2.
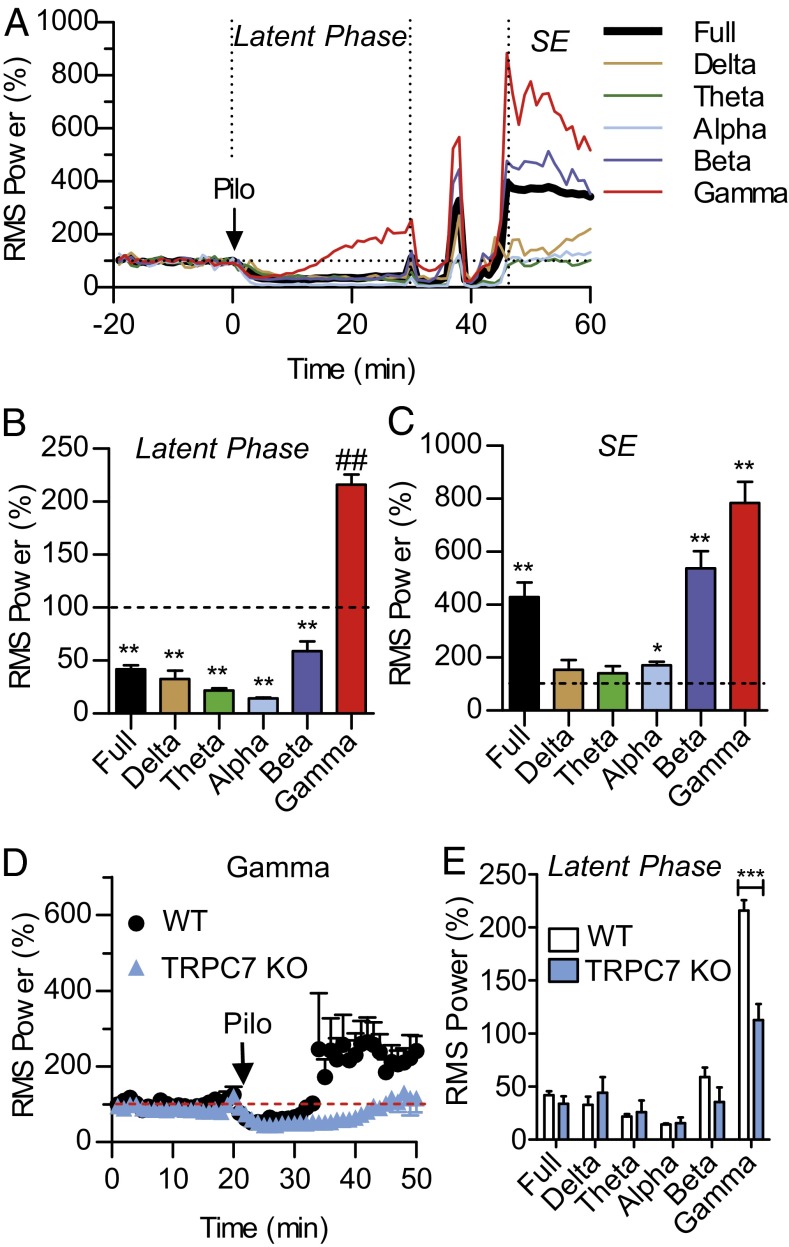
Selective reduction of Pilo-induced increase in gamma wave activity in TRPC7 KO mice. (A) The rms power analysis of EEG signals from representative WT mice using a 10-s window and averaged for each minute were plotted over 70 min after the administration of a single dose of Pilo (280 mg/kg; i.p.). The normalized full bandwidth, the delta wave (0.5–4.5 Hz), the theta wave (5–7.5Hz), the alpha wave (8–12 Hz), the beta wave (12–30 Hz), and the gamma wave (30–50 Hz) were plotted. Note that, during the latent phase, there was a noticeable increase in gamma wave activity whereas EEG activities in other wavebands remained inhibited. However, once the SE state was reached, there was an increase in multiple wavebands. (B) Pooled data plotting the rms power measured over a 5-min period just before the first appearance of cortical seizures in WT mice (n = 5). Note that, with the exception of the gamma wave, all other waves remained significantly inhibited by Pilo at this time point (**P < 0.01; ##P < 0.01, one-sample t test). (C) Pooled data plotting the rms power during the SE state measured at 60 min after Pilo injection in WT mice (n = 5). Note that the full bandwidth and the alpha, the beta, and the gamma waves were all significantly increased above the pre-Pilo baseline (*P < 0.05; **P < 0.01, one-sample t test). (D) Pooled data plotting the rms power of the gamma wave after Pilo injection in WT and TRPC7 KO mice (n = 5 and 5, respectively). Note the significant reduction in TRPC7 KO mice (***P < 0.001 for genotype effects, two-way ANOVA). (E) Pooled data plotting the rms power measured over a 5-min period just before the first appearance of cortical seizures in WT mice (n = 5) and during the same time period in TRPC7 KO mice (n = 5). Note the highly significant reduction in gamma wave activity in TRPC7 KO mice (***P < 0.001, t test).

