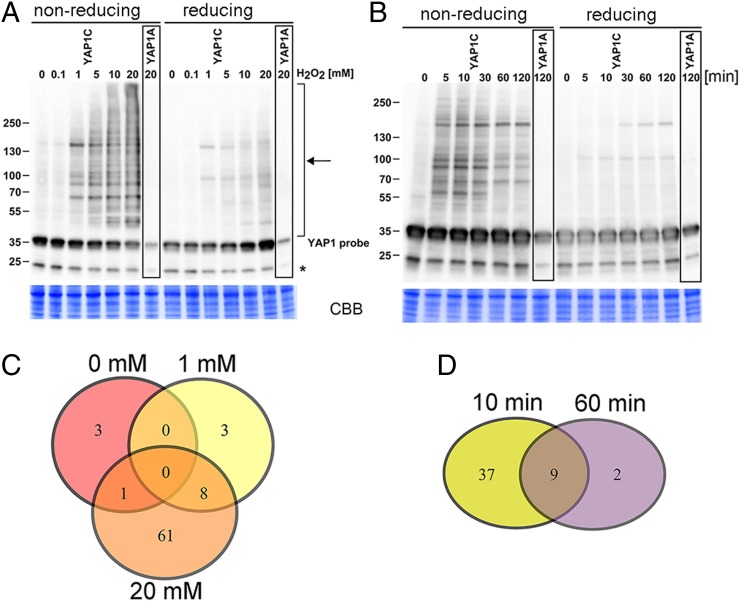
Fig. 1.
Dose- and time-dependent formation of YAP1C-involving complexes. (A) Cell cultures overproducing the YAP1C/YAP1A-GS probe treated with 0, 0.1, 1, 5, 10, and 20 mM H2O2 for 1 h. Complexes (marked with an arrow) are visualized with the PAP antibody complex. The H2O2 concentration and the signal intensity clearly correlate. Treatment of protein samples with 50 mM tris(2-carboxyethyl)phosphine led to reduction of the complexes. (B) Cell cultures treated with 1 mM H2O2. The time course was taken after 0, 5, 10, 30, 60, and 120 min. The initial signal intensity peak returns to a near basal level after 120 min of treatment. The asterisk denotes an unknown protein recognized by the antiserum. (C and D) Schematic comparison of datasets identified after treatment of cultures with 0, 1, and 20 mM H2O2 for 1 h (C) and 1 mM H2O2 for 10 min (early response) and 1 h (late response) (D).

