Fig. 3.
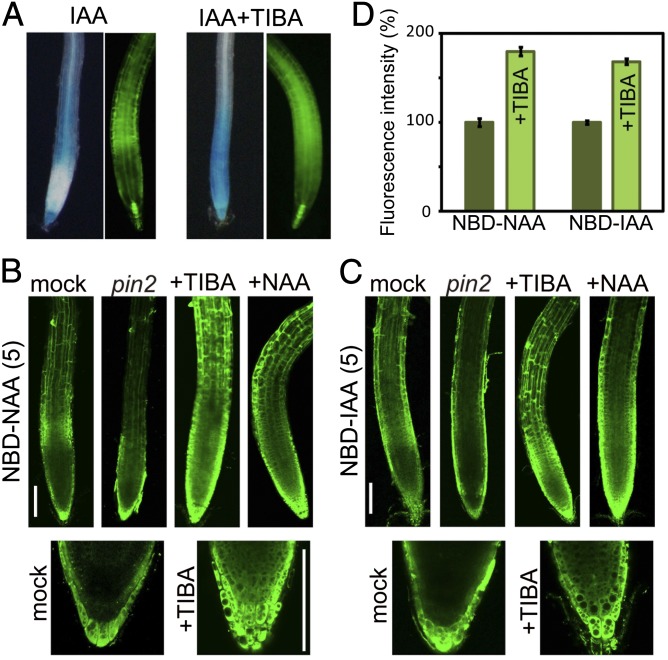
Auxin transport system affects the distribution of fluorescent auxin in roots. (A) Effects of auxin transport inhibitors on the auxin-responsive DR5 expression profile. Six-day-old DR5::GUS (Left) and DR5::GFP (Right) lines were treated with or without 20 μM TIBA, together with 2 μM IAA, for 5 h or 8 h, respectively. (B and C) Wild type (Columbia-0) and pin2/eir1-1 mutants were treated with 5 μM NBD-auxins for 15 min. Wild-type roots were preincubated with 20 μM TIBA or 50 μM NAA for 4 h and 30 min, respectively, and then treated with 5 μM NBD-auxins, together with TIBA and NAA, for 15 min. The values presented in parentheses indicate the concentration of chemicals (μM). (Scale bars, 100 μm.) (D) Arabidopsis MM1 cells were incubated with 2 μM NBD-auxins with or without 50 μM TIBA for 30 min after preincubation with TIBA for 3 h. NBD-auxins were extracted from the harvested cells using methanol and quantified with a fluorometer. Error bars represent SEM; n = 6.

