

Abstract
X-ray diffraction patterns from crystals of biological macromolecules contain sufficient information to define atomic structures, but atomic positions are inextricable without having electron-density images. Diffraction measurements provide amplitudes, but the computation of electron density also requires phases for the diffracted waves. The resonance phenomenon known as anomalous scattering offers a powerful solution to this phase problem. Exploiting scattering resonances from diverse elements, the methods of multiwavelength anomalous diffraction (MAD) and single-wavelength anomalous diffraction (SAD) now predominate for de novo determinations of atomic-level biological structures. This review describes the physical underpinnings of anomalous diffraction methods, the evolution of these methods to their current maturity, the elements, procedures and instrumentation used for effective implementation, and the realm of applications.
Keywords: crystal structure, multiwavelength anomalous diffraction (MAD), resonant diffraction, single-wavelength anomalous diffraction (SAD), synchrotron radiation, x-rays
1. Introduction
X-ray diffraction patterns from crystals of biological macromolecules contain decisive information for determining structures in atomic detail. Provided that the diffraction extends to Bragg spacings corresponding to ~3 Å resolution, a typical pattern will have a number of observable, symmetry-independent reflections that exceeds the number of x,y,z parameters needed to specify atomic positions for the non-hydrogen atoms of the structure. At even lower resolution (~5 Å), the number will still suffice to specify conformational torsion angles. Thus, in principle, diffraction data define the structure; however, the structural implication is through a large set of transcendental equations, each of which depends on all of the atomic parameters. This problem is intractable without having a model within the radius of convergence for refinement. There are no lenses for the hard x-rays needed for crystallography, as there are for visible light (optical lenses), electrons (magnetic lenses) or even soft x-rays (Fresnel zone plates), so the starting model cannot come from direct imaging. Fortunately, by the theory of diffraction, computational imaging by Fourier transformation is possible once phases as well as amplitudes are known for the diffracted waves. Hence, we face the phase problem – the need for ways to evaluate phases.
Crystallographic structure determination for biological macromolecules is influenced greatly by the small molecule tradition, which began with the solution of salt and mineral structures by trial-and-error approaches (Bragg, 1913b; Bragg & Bragg, 1913; Bragg, 1914) and later exploited images of interatomic-vector distributions (Patterson, 1934; Patterson, 1935). The first approaches that really entailed phase evaluation, made relevant when Fourier syntheses were introduced (Bragg, 1929), were by isomorphous replacement from a centrosymmetric series of phthalocynines (Robertson, 1936) and by the heavy-atom method as first used for the structure of platinum phthalocyanine (Robertson & Woodward, 1940). In the heavy-atom method, phases were approximated by the contribution from the heavy atom and used to produce images of the lighter atoms. This approach was followed by the more general isomorphous replacement method for non-centrosymmetric structures (Bijvoet et al., 1948; Bijvoet et al., 1949) as introduced in solving the structure of strychnine (Bokhoven et al., 1951). In this first application of isomorphous replacement, diffraction differences from substitution at a specific atomic site were exploited to obtain definitive phase information, albeit ambiguous in this case. Remarkably presaging the coming importance of selenium in biological crystallography, the substitution here was of selenate for sulfate. Finally, direct methods were derived for extracting phase information from relationships among crystallographic structure factors (Karle & Hauptman, 1950; Hauptman & Karle, 1953; Karle & Hauptman, 1956), and computer implementations of direct methods came to dominate in small molecule crystallography.
Only isomorphous replacement was carried forward very directly from small molecule crystallography to macromolecular crystallography (Green et al., 1954; Blow, 1958). As adapted to include multiple heavy-atom derivatives for resolving inherent ambiguities, the method of multiple isomorphous replacement (MIR) dominated in the first decades of protein crystallography. Anomalous scattering was realized to provide significant ancillary phase information (Blundell and Johnson, 1976), which was used to augment MIR phasing into MIR with anomalous scattering (MIRAS) and to resolve ambiguities from single isomorphous replacement (SIR) as the SIRAS method (Blow and Rossmann, 1961; Herriott et al., 1970). Anomalous scattering information was also shown to suffice on its own for phase evaluation in the solution of the structure of crambin (Hendrickson and Teeter, 1981), which we now see as the first application of method of single-wavelength anomalous diffraction (SAD). Ultimately, with the availability of tunable x-rays from synchrotron sources, practical implementation of the method of multiwavelength anomalous diffraction (MAD) was realized (Kahn et al., 1985; Hendrickson; 1985). Apart from isomorphous replacement, the small molecule methods are too weak to be effective for most macromolecular problems; however, the small molecule tradition influenced biological crystallography in many other ways. Patterson methods and direct methods are crucial for solving the substructures of phasing elements needed in MIR/SIR and MAD/SAD applications. Most importantly, the method of molecular replacement of knowns into unknowns (Lattman et al., 1971; Rossmann, 1972), which now dominates in macromolecular crystallography, is in essence a phase borrowing closely related to that of the heavy-atom method. The crucial innovation here was the rotation function by Rossmann & Blow (1962).
Anomalous diffraction follows from the foundations of crystallography and the early development of protein crystallography, but it also has important roots in spectroscopy and, of course, an essential connection to synchrotron radiation. Synchrotron radiation, which was brought to the attention of biological crystallographers by Rosenbaum et al. (1971), provides a bright continuum of x-rays; and fine tuning to the sharp resonant transitions responsible for anomalous scattering is critical for MAD phasing experiments and for optimized SAD phasing experiments. Such tuning was brought into practice for x-ray absorption spectroscopy (Kincaid et al., 1975), and then adapted for anomalous x-ray diffraction experiments (Phillips et al., 1978).
The development and characteristics of MAD and SAD phasing have been described in several previous reviews (Fourme & Hendrickson, 1990; Hendrickson, 1991; Ogata and Hendrickson, 1995; Hendrickson and Ogata, 1997; Hendrickson, 1999; Walsh et al., 1999; Smith and Hendrickson, 2001; Blow, 2003). It took some time for this methodology to mature, however. Meanwhile, in the last decade and after most of these reviews, MAD and SAD have overtaken MIR and SIR and they now dominate dramatically as methods for the de novo crystal structures of biological macromolecules. In this review, I describe the overall course of development and document the impact of anomalous diffraction methods.
2. Physical basis for anomalous scattering
The interaction of x-rays with matter results in diverse physical phenomena including absorption, fluorescence, refraction, and scattering (Als-Nielsen & McMorrow, 2011). These physical properties can be applied to problems in chemistry, biology and medicine including radiographic diagnosis and crystallographic structure determination. Our concern here is with the latter, which is based on elastic scattering whereby the incident x-ray energy (and hence wavelength) remains unchanged. X-rays are scattered from electrons, and the classical description of elastic scattering worked out by J. J. Thomson (1906) for a free electron applies to good approximation for electrons in atoms as well. An incident electromagnetic wave induces sympathetic vibrations in the electron and the accelerated electron emits radiation in accord with Maxwell’s equations. When integrated over the probability density for all electrons in an atom, as specified by the quantum-mechanical wave function, a total atomic scattering profile can be defined relative to the theoretical scattering from a free electron. This is the ‘normal’ atomic scattering factor, f°, which decreases with scattering angle as a function of S = |S| = 2 sin(Θ)/λ where S = ha* + kb* + lc* is the scattering vector for reflection h(h,k,l) from a crystal with reciprocal cell dimensions a*,b*,c*, Θ is the Bragg scattering angle, and λ is the x-ray wavelength.
In reality, electrons are not passively free to respond to incident radiation; they are tied up into electronic orbitals at characteristic frequencies. As the x-ray oscillatory frequency approaches an atomic orbital frequency, the induced electron vibrations can resonate with the natural oscillations of the bound electrons, or more precisely with transitions from bound states to other accessible orbitals. This perturbs the atomic scattering (James, 1948; Als-Nielsen & McMorrow, 2011). Such interactions also lead to photoelectric absorption whenever the x-ray energy exceeds the orbital binding energy, the absorption edge. This generates an ionized atom and a photoelectron; and such photoelectrons may recombine with the resulting ions to produce fluorescent x-rays with an energy characteristic of the particular electronic transition. The scattering perturbations due to orbital interactions add to the ‘normal’ Thomson scattering with increments, fΔ, that have both amplitude and phase shift components, |fΔ| and δ, and corresponding real and imaginary components, respectively f′ and f″. Thus, the true atomic scattering factor, f, is complex:
| (1) |
The fΔ scattering perturbations are known as ‘anomalous’ scattering even though all electrons of interest are in electronic orbitals and truly are the norm. Physically, anomalous scattering is intimately connected to resonance and to absorption, and it is dispersive since the effect depends strongly on x-ray energy (E). Since anomalous scattering derives from core electrons, it is essentially independent of scattering angle; however, unlike normal scattering, it is a function of wavelength. Thus, fΔ = f (λ) ≠ f (S) whereas f° = f (S) ≠ f (λ).
The spectra f′(λ) and f″(λ) can be evaluated for isolated atoms from quantum mechanical calculations (Cromer & Liberman, 1970), but these do not apply for many resonant transitions which are from core atomic orbitals to unoccupied molecular orbitals. Fortunately, however, these factors can be evaluated experimentally from the connection between scattering, absorption and fluorescence. By Fresnel diffraction theory, the f° scattered wave is π/2 out of phase with the incident wave (James, 1948), and f″ is out by another π/2; therefore, in the forward direction, the f″ component interferes destructively with the incident beam. This is the physical basis for absorption; f″(E) = K μ(E) • E where K is a function only of physical constants and μ is the atomic absorption coefficient. The direct proportionality of fluorescence to absorption then makes the f″(λ) spectrum accessible [f″(λ) and f″(E) are equivalent since E = hc/ λ; E(keV)=12.3984/λ(Å)], and f′(λ) follows by Kramers-Kronig transformation (Lye et al., 1980; Hendrickson et al., 1988). The full range of x-rays for diffraction experiments (~ 3.5 – 35 keV or 0.35 – 3.5 Å) includes K and/or L absorption edges for all elements of Z ≥ 20 (Ca and upwards) (Hendrickson & Ogata, 1997). The light atoms of macromolecules (H, C, N and O) have negligible anomalous scattering in this range, but the f″ values for S and P are sufficiently substantial to be useful. Resonant enhancements can be pronounced even at K-edges as in selenoethers (Fig. 1a), and they can be dramatic at the M-edges of actinides and at the LIII-edges of lanthanides (Fig. 1b).
Figure 1. Anomalous scattering factor profiles.
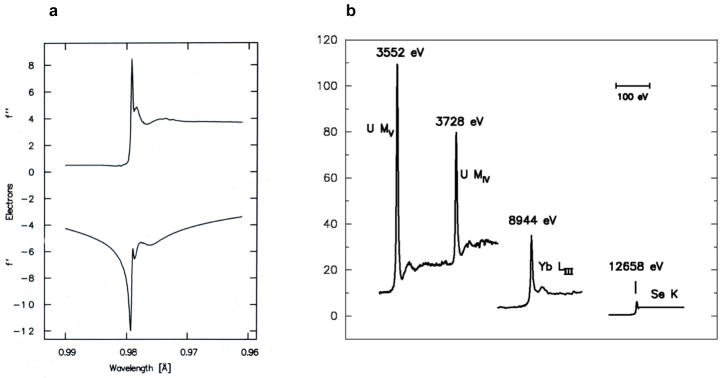
(a) Se K-edge anomalous scattering factors. These data derive from an x-ray absorption spectrum of selenomethionyl thioredoxin (Hendrickson et al., 1990), and the figure is reproduced from that work. (b) Imaginary components of anomalous scattering at different absorption edges. The U MIV and U MV edges are from uranyl nitrate (Liu et al., 2001), the Yb LIII edge is from a ytterbium-derivatized crystal of N-cadherin (Shapiro et al., 1995), and the Se K edge is from a crystal of selenomethionyl human choriogonadotropin (Wu et al., 1994). Reproduced from Liu et al. (2001).
3. Historical background
3.1 Discovery and description of anomalous scattering
The first recorded evidence for anomalous x-ray scattering was from Mark and Szilard (1925) who showed that diffraction from RbBr crystals differed selectively depending on the wavelength of irradiating x-rays. The RbBr structure is like that of rock salt (NaCl) and, as Rb+ and Br− ions are isoelectronic and have equivalent f° scattering factors, only even orders of [111] diffraction were observed with x-rays from Fe, Co, Cu or Zn anodes, which have x-ray energies (7.1 – 9.7 keV) remote from the absorption edges of Rb or Br. With Sr Kα radiation, however, both the (1,1,1) and (3,3,3) diffraction lines were also observed; here the stimulating x-rays (14.1 keV) fall between the K absorption edges of Br (13.5 keV) and Rb (15.2 keV) whereby the anomalous scattering appreciably and differentially affects the net Br and Rb scattering.
An especially celebrated demonstration of anomalous scattering came from an elegant experiment by Coster, Knol and Prins (1930) showing the breakdown of Friedel’s law, I(h,k,l) ≠ I(−h,−k,−l), in diffraction from zincblende (ZnS). Using a gold anode to produce x-rays, these investigators found dramatic differences in the ratio of intensities in Au Lα1 to Au Lα2 lines seen for (1,1,1) as compared with (−1,−1,−1) reflections and also for (3,3,3) vs. (−3,−3,−3) reflections. The Zn K absorption edge (9.66 keV) falls between the two Au L lines, with Au Lα2 (9.63 keV) being below the edge and Au Lα1 (9.71 keV) being above the edge; thus, since f″(Zn) is then large at Lα1, the differences in intensities between Friedel mates are also large. According to Ramaseshan (1993), this influential study was inspired by similar zincblende experiments, albeit more preliminary, based on tungsten Lβ lines (Nishikawa & Matukawa, 1928).
Quantification of the dispersion of x-rays came from accurate measurements of atomic scattering factors as a function of x-ray wavelength in the neighborhood of an absorption edge. Observations by Wyckoff (1930) on nickel oxide with Mo Kα, Cu Kα and Ni Kα radiations were especially notable in this context, showing dispersion for Ni scattering factors but not for O scattering factors.
The observation of anomalous dispersion of x-rays prompted theoretical investigations of the phenomena (Kallman and Mark, 1927); and, to an extent, theoretical studies (Prins, 1928) spurred the experiments. The quantum dispersion theory (Kramers and Heisenberg, 1925) was extended to analysis of the refraction, absorption and dispersion of x-rays (Kronig, 1926; Kronig and Kramers, 1928). The most complete quantum elaboration came in the theory of Hönl (1933), which used atomic wave functions to obtain oscillator strengths and from them the photoelectric absorption cross-sections were needed to calculate scattering factor corrections.
3.2 Antecedents of MAD and SAD phasing for macromolecules
Phenomena associated with anomalous scattering fascinated physicists as being manifestations of the quantum nature of atoms and for developing x-ray diffraction theory. Even though phase shifts were understood to accompany the resonances responsible for the anomalies (Coster et al., 1930), there seems to have been no motivation for physicists at the time to exploit these effects for structure determination. Missing such opportunity is understandable since phase evaluation came only later to be employed in structure determination (Robertson, 1936) once Fourier approaches had been introduced (Bragg, 1929; see discussion by Hendrickson, 2013); however, it is surprising that it took so long for this inspiration to strike (Bijvoet, 1949). The lag is all the more remarkable since Bijvoet himself had been instrumental in prompting Ewald to reconsider his ‘proof’ of Friedel’s Law (Ewald & Hermann, 1927).
Reduction to practice for the idea of phase evaluation from anomalous scattering was slow to come, although Bijvoet did develop the method of isomorphous replacement in the same time frame (Bijvoet et al., 1948; Bijvoet et al., 1949). Anomalous differences tend to be smaller than isomorphous differences and, to be general, there are issues of phase ambiguity; however, the deviations from Friedel symmetry in diffraction from rubidium tartrate did suffice to determine absolute configuration for the first time (Bijvoet et al., 1951). Bijvoet later reviewed these influential and pioneering uses of anomalous diffraction (Bijvoet, 1954).
The phase problem was a preoccupying concern in the intellectual ferment of 1950s crystallography, and anomalous scattering stimulated several new formulations for phase determination (Okaya et al., 1955; Okaya & Pepinsky, 1956; Ramachandran & Raman, 1956; Ramaseshan & Venkatesan, 1957; Mitchell, 1957; Raman, 1959; Karle, 1967; Herzenberg & Lau, 1967; Singh & Ramaseshan, 1968). Practical implementations also followed; however, at the time, these were limited to the characteristic wavelengths available from the anode coatings of Roentgen-like x-ray tubes. Nevertheless, pioneering multi-wavelength tests were performed to resolve the phase ambiguity presented by non-centrosymmetric structures. Notably, Ramaseshan et al. (1957) bracketed the Mn K absorption edge with Fe Kα and Co Kα radiations and solved the crystal structure of KMnO4; and Hoppe and Jakubowski (1971) carried out two-wavelength tests on a fly hemoglobin using Co Kα and Ni Kα x-ray, which similarly lie on either side of the Fe K edge of heme.
Ramaseshan (1993) has given an engaging history of early work leading to multiwavelength phasing for biological molecules.
3.3 Synchrotron radiation
The bremsstrahlung emission from x-ray tubes does afford access to a continuous x-ray spectrum, indeed, this continuum proved to be the origin of the first x-ray patterns (Friedrich et al., 1912; Bragg, 1913a); however, the far more intense characteristic x-ray emissions from electron-bombarded anodes became the mainstay for structure determinations. By contrast, the continuum of synchrotron radiation is exceptionally bright across a wide spectrum determined by the critical energy of the source. Soon after the realization that synchrotron radiation could be useful for biological diffraction (Rosenbaum et al., 1971), experiments also followed to extract structural information about metal coordination in metalloproteins by x-ray absorption spectroscopy (Kincaid et al., 1975; Cramer & Hodgson, 1979) and to extract anomalous scattering factors from the finely tuned near-edge variations in x-ray absorption (Phillips et al., 1978; Templeton et al., 1980; Templeton et al., 1982).
That synchrotron measurements of anomalous diffraction from appropriately derivatized crystals could be used effectively in structure determination was appreciated immediately (Templeton et al., 1980; Lye et al., 1980; Phillips & Hodgson, 1980) and a first application came with the test structure of Tb3+-derivatized parvalbumin (Kahn et al., 1985). We had also learned from our experience in determining the structure of crambin from the weak anomalous scattering of Cu Kα x-rays by its intrinsic sulfur atoms that native anomalous scattering can suffice (Hendrickson & Teeter, 1981), and our experience in x-ray absorption spectroscopy of hemerythrin (Hendrickson et al., 1982) indicated that iron proteins might be excellent candidates. Thus, we successfully used lamprey hemoglobin as a first test subject (Hendrickson, 1985; Hendrickson et al., 1988).
We named the new method multiwavelength anomalous diffraction, giving the acronym MAD for its parallel with MIR, then the dominant phasing method. In both cases, information from multiple sets of measurements (at differing wavelengths for MAD and from different isomorphs for MIR) is used to break the trigonometric phase ambiguity that occurs in general when only a single set of measurements is used. The first use of the term MAD, to the best of my knowledge, was in a main lecture at the IUCr Congress in Hamburg in 1984 (Hendrickson, 1984), and this term was then adopted in the first publications describing structure determinations by the method (Kahn et al., 1985; Hendrickson, 1985; Harada et al., 1986).
4. Theoretical foundation for phase evaluation from anomalous diffraction
Our analysis for deriving phase information from measurements of anomalous diffraction is based on the fundamental additivity of scattered x-ray waves, whereby one here exploits the interference between scattering from anomalous centers and that from all other atoms. We distinguish the relatively few anomalous scatterers (A), for which the anomalous component (fΔ) is substantial, from the many ‘normal’ scatterers (N), for which fΔ is considered negligible, and the sum of the two gives the total from all atoms (T) in the structure. Since deviations from normal diffraction arise only from the anomalous scatterers, it is possible to isolate the anomalous contribution to the total diffraction and from it to deduce positions for the anomalous scatterers. With these scattering components in hand, both in phase and amplitude, then by the principles of interference it becomes possible to deduce the otherwise unknown phases for diffracted waves from the total structure. We perform this analysis in a unified treatment of all observations, using an algebraic approach developed in principle by Karle (1980) and reduced to practice after reformulation (Hendrickson, 1985; Hendrickson et al., 1988; Hendrickson, 1991).
Each kind of anomalous scatterer (k), having distinctive scattering factors, contributes to the total diffraction as the sum of a wavelength-independent component due to its normal scattering (f°) and a wavelength-variant component due to its anomalous scattering (fΔ = f′ + i f″). Thereby,
| (2) |
where λFAk denotes the complete wavelength-dependent contribution of atoms Ak, which is composed from °FAk = f (f°k), λFAk′ = f (f′k), and λFAk″ = f (f″k). Furthermore, since the normal scattering component of each anomalous scatterer contributes along with all normal scatterers to the total scattering, °FT = °FN + Σk°FAk. Thus, diffraction measurements associated with a specified Bragg reflection h(h,k,l) made at a particular wavelength λ are given by
| (3) |
where λF(h) is the wavelength-dependent total structure factor for reflection h, and °FT(h) = |°FT| exp(i°ϕT) and °FAk (h) = |°FAk| exp(i °ϕAk) are corresponding wavelength-invariant components.
Eq. (3) is general as the kinds of anomalous scatterers can be arbitrarily broad; however, in most cases the number of effective kinds is limited, often just to one. Usually, the light atoms (H, C, N and O) of macromolecules are treated as ‘normal’ scatterers having scattering factors f = f° even though an anomalous scattering component (fΔ = f′ + i f″) is never strictly absent. Moreover, for measurements made at higher energy (>7 keV) the components from S and P atoms can be considered negligible relative to those at resonance from heavier elements such as Fe, Se, Hg or Yb. Even when multiple kinds of anomalous scatterers are present, one kind usually dominates; and to a useful initial approximation the equation can be so limited.
The observable quantity in a diffraction experiment is the diffracted intensity I(h) = K |F(h)|2; and |F|2 expands by Eq. (2) for the case of a single kind of anomalous scatterer to
| (4) |
where
Only the wavelength-invariant normal scattering factors f° contribute to °FT and °FA, amplitudes and phases, including all atoms for °FT but just one kind of anomalous scatterer for °FA. All wavelength dependence is separated into factors a(λ), b(λ) and c(λ) defined by the spectral dependence of anomalous scattering.
Eqs. (4) encode an elegant and unified theory that can afford a definitive solution of the phase problem, which is implemented in the MADSYS system of programs (Hendrickson, 1985; Hendrickson, 1991). Normal scattering factors f° are known from quantum mechanical calculation, and the anomalous scattering factors f′ and f″ can be deduced from a combination of x-ray absorption spectra and theory (Hendrickson et al., 1988), whereby wavelength dependent factors a(λ), b(λ) and c(λ) are determined. Alternatively, these factors can be refined from rough approximations (Templeton & Templeton, 1982; Fanchon & Hendrickson, 1990; Weis et al., 1991). The set of observations, {|λF(h)|2}, of Bijvoet mates at various wavelengths constitute, for each reflection h, a set of simultaneous equations (Eq. 4) that can be solved subject to trigonometric identities to yield the wavelength-invariant structure-factor quantities: |°FT(h)|, |°FA(h)| and Δϕ = (°ϕT − °ϕA). The set of |°FA(h)| from all reflections can then be used to determine and refine the atomic sub-structure of anomalous scattering centers, {rA}, by relatively straightforward Patterson or direct methods. Phases calculated from this substructure solve the phase problem, °ϕT = Δϕ + °ϕAcalc, provided that the correct enantiomorph, {±rA}, has been determined. In practice, the solution is represented as a phase probability distribution (Pähler et al., 1990).
In addition to providing a possible algebraic solution, Eq. (4) also provides useful, approximation-free descriptions of the deviations from normal diffraction due to anomalous scattering. It is evident that |λF(h)| is independent of wavelength in the absence of anomalous scattering (fΔ = 0); and then structure factor values are independent of wavelength and identical for Friedel mates |λF(±h)| or their symmetry equivalents (called Bijvoet mates). Deviations of |λF(±h)| from |°FT(h)| are often small and best captured in salient differences. The Bijvoet difference is directly proportional to f″ and to sin(Δϕ):
| (5) |
If anomalous scattering effects are relatively small, as commonly happens, then |°FT(h)| ≈ (|λF(h)| + |λF(−h)|)/2 and one obtains the Bijvoet-difference equation used for the SAD phasing analysis of the crambin structure (Hendrickson & Teeter, 1981):
| (6) |
from which there are two possible values of °ϕT when the atomic sub-structure of anomalous scattering centers, {rA}, is known. Absent data from multiple wavelengths, other added information such as from density modification methods is needed for resolution of this phase ambiguity.
Dispersive differences between two wavelengths, λi and λj, are more complicated, but they can be described as the differences between the respective intensity means, <|λF(h)|2> = (|λF(h)|2 + |λF(−h)|2)/2:
| (7) |
Unless |°FA(h)| is on the order of |°FT(h)|, which only happens for very strong anomalous scattering, the second term dominates and |°FT(h)| ≈ (<|λiF(h)|> + <|λjF(h)|>)/2. In such typical cases, the dispersive difference is thereby:
| (8) |
Whereas Bijvoet differences are proportional to f″ (λi) and sin(Δϕ), dispersive differences are proportional to |f′(λi) - f′(λj)| and to cos(Δϕ), which nicely demonstrates the orthogonality of information needed for definitive phase evaluation.
It is helpful to have estimates of the strength of signal expected in a MAD or SAD experiment, and the approximations of Eqs. (6) and (8) for Bijvoet and dispersive differences make such estimates possible. We do this by obtaining the ratios of relevant averaged anomalous differences relative to the averaged total diffraction (Hendrickson, 1991), where averages are taken as root-mean-squared (rms) values over all data with extrapolation to zero scattering angle. Since the expected value for lim (h→0) <|λF(±h)|2> ≈ <|°FT(h)|2> = Σ f°(0)2 ≈ NT Zeff2 where NT is the number of non-hydrogen atoms and Zeff is the effective atomic number for an average non-hydrogen atom. Thus, Rms (FT) ≈ √NT Zeff. Zeff = 6.7 for proteins. A similar averaging pertains to differences from the anomalous substructure, but here the averaging must include the trigonometric factors, where <sin(Θ)> = <cos(Θ)> = ½. Taken all together, we obtain the ratios
| (9) |
and
| (10) |
MAD experiments can be thought of as in situ MIR experiments, carried out with physical instead of chemical replacements, and they can be analyzed accordingly (Phillips & Hodgson, 1980) or by earlier alternative methods (Okaya & Pepinsky, 1956). The dispersive differences defined by Eq. (7) are like those in isomorphous replacement and the Bijvoet differences defined by Eq. (6) are like the anomalous differences added to give SIRAS and MIRAS.
5. Development of MAD
The antecedents of MAD analyses for macromolecules did include the remarkable two-wavelength test on Chrionomus hemoglobin by Hoppe & Jakubowski (1971) and the single-wavelength structure of crambin (Hendrickson & Teeter, 1981), both using characteristic Kα lines from metal anodes; however, the true beginnings of MAD came with developments from synchrotron radiation.
5.1 Beginnings of MAD phasing for macromolecules
The first published MAD analysis of a protein structure was that for a parvalbumin from the toadfish Opsanus tau. Kahn et al. (1985) performed a three-wavelength experiment at LURE, taking advantage of the strong white-line resonance of Tb3+, which was substituted into Ca2+ sites. Measurements were made at the absorption maximum (λ = 1.649 Å), at the inflection point (Δλ = 0.0011 Å) and at a shorter wavelength (Δλ = −0.0021 Å). These wavelengths corresponded to an energy of 7.5137 keV at the LIII-edge, an energy 5 eV beyond the edge at the absorption peak, and a slightly remote energy just 15 eV above the edge. Scattering factor values were first estimated from the scan of differences from a particularly strong Bijvoet pair and then refined against the complete data set. An electron-density map computed at 2.3 Å resolution compared favorably with the structure solved independently by molecular replacement.
In the same timeframe, experiments were conducted at SSRL using lamprey hemoglobin as a test problem, and it was results from these experiments that were used to describe MAD phasing at the IUCr Congress in 1984 (Hendrickson, 1984). The lamprey hemoglobin analysis was first described at 5.5 Å resolution (Hendrickson, 1985) and then at 3.0 Å resolution (Hendrickson et al., 1988). This was a four-wavelength experiment that included the inflection (edge) and peak positions at the Fe K-edge as well as a remote low- and high-energy positions, respectively 245 and 1140 eV below and above the edge. Fluorescence measurements of x-ray absorption were scaled to fit theoretical f″ values outside the edge region (6.68 – 7.40 keV) and then used to derive f′ values by Kramers-Kronig transformation (Kronig and Kramers, 1928). The extended span of energies here was chosen, as illustrated in Fig. 2, to enhance the dispersive signals which depend on Δf′ = f′ (λi) - f′ (λj). Crystals were mounted in capillaries and maintained at ~10°C, and diffraction data were measured with a multi-wire electronic area detector.
Figure 2. Experimental anomalous scattering factors for lamprey hemoglobin.

(Left) Imaginary and real components, above and below respectively, of Fe scattering factors in type D2 lamprey hemoglobin, measured with E parallel b. Experimental fluorescence data were fitted into theoretical atomic scattering factor spectra, retaining experimental values in the near-edge region. Wavelengths of the diffraction measurements are indicated by arrows. (Right) Herzenberg-Lau scattering factor profiles (Herzenberg & Lau, 1967). Wavelengths of diffraction measurements are indicated by solid circles. Reproduced from Hendrickson et al. (1988)
Other early MAD experiments were also conducted at low resolution or on test systems (Harada et al., 1986; Korzun, 1987), but the focus of attention soon moved to true applications. The first of these to be reported was that for cucumber basic blue protein by Guss et al. (1988), a structure that had eluded attempts by other methods. This study used the same experimental approach and instrumentation as that employed in the lamprey hemoglobin work, but in this case copper atoms produced the anomalous scattering. A four-wavelength experiment was conducted as for lamprey hemoglobin, here ranging from 949 eV below the edge to 1040 eV above the edge. The MAD data were measured to 2.5 Å spacings, but then used to compute electron density maps at 3.0 Å resolution from which the structure was interpreted and subsequently refined at 1.8 Å resolution.
Our own first application to a novel structure was that to streptavidin, which we solved as a complex with selenobiotin (Hendrickson et al., 1989). Experiments were conducted both at SSRL and at a diffractometer facility at Photon Factory beamline 14A. Whereas high energy resolution at SSRL permitted a characterization of anisotropy in anomalous scattering from seleonbiotinyl streptavidin, resulting diffraction data measured there were of insufficient quality for an interpretable result. Despite poor energy resolution at PF 14A, a three-wavelength MAD experiment (inflection, peak and a remote point 1118 eV above the edge) gave a readily interpretable map that was further improved by averaging of non-crystallographic symmetry (Fig. 3). The excellence of this result based on a single Se atom from selenobiotin also inspired us to develop selenomethionyl proteins, which prove to provide great generality for MAD analyses (Hendrickson et al., 1990).
Figure 3. MAD-phased electron-density distributions for selenobiotinyl streptavidin.

(Left) Map at 3.3 Å resolution based exclusively on MAD phasing (m = 0.78). (Right) Map at 3.3 Å resolution after two-fold molecular averaging refinement of initial phases (m = 0.90). Reproduced from Hendrickson et al. (1989).
After these initial successes, we undertook additional MAD phasing experiments using beamlines at various synchrotrons to solve other novel structures, sometimes in collaborations and often through the use of selenomethionine. The resulting structures included interleukin 1-α (Graves et al., 1990), ribonuclease H (Yang et al., 1990), mannose-binding C-type lectin (Weis et al., 1991), urechis hemoglobin (Kolatkar et al., 1992), and tenascin (Leahy et al., 1992). During this period, we also used MAD data measured from gold-anode bremsstrahlung for our structure of CD4 (Ryu et al., 1990), and others reported a MAD-phased structure of cytochrome c553 (Nakagawa et al., 1990). All of these early results were obtained before cryoprotection was introduced to reduce radiation damage. Subsequently, with additional advances in instrumentation and analytic procedures, MAD usage expanded rapidly as described below in Section 7.
5.2 Experimental procedures
Experimental procedures introduced in early applications of MAD phase evaluation had considerable influence on the practices that followed as MAD blossomed. On the other hand, technical developments in available instrumentation and procedures as well as advances in data processing and analytical procedures have led to substantial evolution in standard practices, in many ways simplifying the process. Nevertheless, MAD presents several experimental alternatives to consider.
A primary consideration concerns the choice of atomic element and electronic resonance for the MAD experiment. In an earlier review (Hendrickson & Ogata, 1997), we tabulated all of the absorption edges within what we defined to be an accessible energy range of 3.5 to 35 keV (3.5 to 0.35 Å in wavelength) showing that all elements from atomic number 20 (Ca) to 92 (U) have K or LIII edges in this range, and sometimes both. Moreover, elements having edges within a more convenient central range (7 to 17 keV, 1.7 to 0.7 Å) include many transition elements and other metals (e.g. Fe and Mo) found in metalloproteins, elements such as Se and Br that can be introduced covalently into biological molecules, many of the lanthanides used to substitute for Mg2+ or Ca2+, and nearly all ‘heavy atoms’ conventionally used for MIR and SIR. Whereas MIR analyses had focused on conventional heavy atoms with Z ≥ 73 (Ta), the earliest MAD experiments included successes with much lighter elements such as Fe, Cu and Se (Z = 26, 29 & 34, respectively). Later MAD and SAD experiments have covered a broad range of elements, but systematic incorporations of Se in selenomethionyl proteins and Br in brominated nucleic acids have dominated for these respective macromolecules.
Given an element and its resonance, the next questions for experimental design are about how many and which wavelengths to use. The typical answer for MAD has been three or four. Since f″ factors are proportional to atomic absorption, fluorescence spectra of atomic absorption are important for decisions on choice of wavelengths. To be optimal, one wavelength should be at the peak of f″ since by Eq. (9) this specifies the greatest Bijvoet differences. Similarly, by Eq. (10) for dispersive differences, one seeks to maximize the f′ difference between two wavelengths. One of the two is obviously at the minimum in the f′ profile, which is identified at the ascending inflection point in the f″ profile (Figs. 1a & 2), but there are multiple options for the second. For lanthanide LIII or uranium M edges (Fig. 1b), the descending inflections of the white-line transitions mark advantageous local maxima; for K-edge experiments, the near-edge local maxima are less pronounced (Fig. 1) and other wavelengths can be chosen low or high energy remotes (Fig. 2). Since Bijvoet and dispersive differences are orthogonal in dependence on phase angles (Eqs. 6 & 8), having strong differences for both is desirable for definitive phase determination. That said, as described below, the increasing success of SAD shows that very effective phase evaluations can also be made at a single wavelength.
Since the anomalous diffraction signals in many early MAD applications were expected to be relatively small, careful strategies were adopted to measure these small differences as precisely as possible. In particular, concerns about the effects of absorption and radiation damage led to procedures by which all data pertaining to a given phase (Bijvoet mates at different wavelengths) would be measured close together in time and with similar experimental conditions. To control for systematic error in Bijvoet differences, crystals were often aligned for mirror symmetric simultaneity in diffraction (Hendrickson et al., 1988; Guss et al., 1988) or, more generally for when mirrors are absent, by inverse-beam geometry. The ‘inverse-beam’ method, which was introduced for streptavidin measurements at SSRL (Hendrickson et al., 1989), follows each diffracted image with one made after rotating by 180° about an axis perpendicular to the x-ray beam. If Friedel’s law holds and alignments are perfect, the two images will be as if related by inverted beams, simply related by a mirror perpendicular to the axis of 180° rotation; if anomalous scattering is present, the Friedel mates will show differences but many common systematic errors will cancel. To control for systematic errors at different wavelengths, such as from progressive radiation damage, data would be recorded wedge-by-wedge or block-by-block, iterating among wavelengths and through inverse beams.
Early MAD experiments were conducted at room temperature or with limited cooling (e.g. at 4°C); however, flash freezing to ~100 K became the norm after cryoprotection procedures were perfected (Rodgers, 1994). The greatly reduced radiation damage with freezing was a special boon to MAD given its need for multiple data sets. The first MAD structure from a frozen crystal was of human chorionic gonadotropin (Wu et al., 1994), and subsequent MAD results came almost exclusively from flash-frozen crystals. Both crystal freezing and the typically larger signals from the multiple sites of selenomethionyl proteins provided access to more challenging systems, and these advances also relaxed the need for special care in data collection. As MAD proved to be convincingly robust, a wide range of data measurement procedures came into use. Although the rates of radiation damage are reduced ~50-fold on going from 300K to 100K (Warkentin & Thorne, 2010), nevertheless, frozen crystals are not immortal and care in measurement strategy remains advisable.
5.3 Synchrotron beamlines
At the time of the beginnings of MAD phasing experiments, synchrotron radiation was already being used in macromolecular crystallography (MX) with a premium on high flux. Many early MX beamlines (e.g. CHESS A1, SSRL 7.1 and DESY X11) used horizontally focusing bent single-crystal monochromators, which were usually operated at a fixed wavelength and these used photographic film as detectors. Such instruments were ill suited for the tuning needed by MAD and for the precision envisioned for data collection. Other beamlines equipped with double-crystal monochromators (e.g. SSRL 1.5, PF 14A and LURE D1.5) and electronic detectors did anticipate multiwavelength experiments on protein crystals. Matching count-rate limitations of the detectors, beam focusing on these latter beamlines was quite limited, however, and data collections took several days. Nevertheless, these beamlines proved effective in early MAD experiments, as described above.
Even the single-crystal monochromator systems could be adapted for MAD, and this was done after imaging-plate detectors were introduced (Amemiya et al., 1988) in early MAD structure determinations at PF 6A2 for cytochrome c553 (Nakagawa et al., 1990) and CHESS F1 for tenascin (Leahy et al., 1992). Later, procedures were developed to achieve high energy resolution from a bent, asymmetrically cut monochromator (Lidestri & Hendrickson, 2009), and the structure of a relatively large selenomethionyl protein complex was determined at horizontally focused NSLS X4C (Moore & Hendrickson, 2012). Many other horizontally focused, single-crystal monochromator systems are now advertised and used as SAD beamlines (http://biosync.sbkb.org/), but typically with limited energy resolution.
As successes mounted from MAD phasing experiments, often performed with special beamline adaptations or suboptimal characteristics, the need for beamlines optimized for MAD phasing became evident. Thus, we set out to develop such a beamline at Brookhaven National Laboratory as NSLS X4A (Staudenmann et al., 1989). X4A was designed to produce monochromatic x-rays, to be tuned conveniently over a wide energy range to accommodate the many absorption-edge opportunities for the method, to have high energy resolution for optimizing experiments at white-line features (Fig. 1b), and to be focused for maximizing fluxes and minimizing data collection times. The first published structures from X4A were of the bacterial redox protein DsbA (Martin et al., 1993) and of human chorionic gonadotropin (Wu et al., 1994), and X4 has been highly productive ever since. MAD beamlines with characteristics similar to X4A were built at other synchrotrons, and among the first of these were ALS 5.0.2, APS 19ID and ESRF BM14. Many others have followed (http://biosync.sbkb.org/).
Advances in x-ray detectors have been critically important for the development of MAD. Multiwire proportional counters (MWPCs) were used for many of the first experiments at LURE D1 and SSRL 1–5, and a single-reflection scintillation-activated proportional counter was used initially at PF 14A. An MWPC detector was also used at LURE D23, notably for mannose-binding protein (Weis et al., 1993); however, count-rate limitations led to a push toward integrating area detectors for MAD phasing. It was with the introduction of imaging plates that MAD phasing really took off, first as read by off-line readers (Amemiya et al., 1988) and later as incorporated into commercial systems as in the Rigaku R-axis IV and the MAR345 detectors. Ever brighter beamlines led a push to fast detectors, first by way of charge-coupled detectors (CCDs, such as the ADSC Q315) as supplied by several vendors and more recently in the move to pixel array detectors (PADs, such as the Pilatus 6M).
5.4 Analytical and computational procedures
The analysis for MAD or SAD experiments begins with data reduction whereby the structure-dependent components, the |F(h)| amplitudes of structure factors, are extracted from the observed intensities, I(h). This is done, as in the modus operandi for crystallographic structure determinations generally, by determining and applying the various scaling and correction factors that relate intensities to structure factors: I(h) = K C1 C2 … CN |F(h)|2. That is, rather than maintaining the actual observations against which models can be tested, the factors related to diverse experimental effects, including ones due to diffraction geometry (Lorentz factors), polarization, absorption, and even radiation damage, are evaluated and used to isolate the structure-dependent quantities. Multiple observations of each unique reflection can be merged together into a unique data set for the Friedel pairs at each wavelength {|λF(h)|, |λF(−h)|}, and often this is done with standard procedures encoded by programs such as HKL2000 (Otwinowski & Minor, 1997), SCALA (Evans, 2011) or XDS (Kabsch, 2010), which do not see distinctions in the mode of measurement. Such blind mergings have the defect, however, that they will obscure the precision that can be facilitated by practices of inverse-beam and mirror-simultaneity discussed above. Using our MADSYS program suite (Hendrickson, 1991), we have used crystal numbers, orientation codes and symmetry codes to preserve individual identities through parameterized local scaling and into phase evaluation by a ‘phase first, merge later’ approach (Hendrickson, 1985). MAD phasing has proved to be robust, however, and many structures have been determined even despite blind mergings of the data. Improvements in accuracy can be expected, however, when attention is paid to the control of systematic errors in anomalous differences.
In addition to the diffraction data, MAD analyses also require knowledge of the anomalous scattering factors, f′ and f″, at each wavelength. These can be obtained from measurements of atomic absorption spectra and Kramers-Kronig conversion by programs such as KRAMIG (Hendrickson et al., 1988) or CHOOCH (Evans & Pettifer, 2001). Alternatively, and commonly in current practice, these values can be refined in the course of phase evaluation (Weis et al., 1991) even from rather crude initial estimates. Anisotropy of anomalous diffraction is seen in atomic absorption for simple cases such as for single-site selenoethers (Templeton & Templeton, 1988; Hendrickson et al., 1989; Hendrickson et al., 1990), and it will also be present even when multiple orientations scramble the macroscopic effects. The intrinsic anisotropy is represented by an atomic scattering tensor, fΔ, and the effective scattering factor, fΔeff, depends on the orientation of that atom with respect to polarization directions of both the incident beam, ê, and the diffracted beam, ê′. Thus,
| (11) |
Effects of anisotropy can be taken into account by refining each scattering tensor (Fanchon & Hendrickson, 1990), which requires unmerged diffraction data and the preservation of crystal orientations at each diffracting event. Our simulations showed that uncorrected anisotropy for selenomethionyl proteins does not spoil MAD phase evaluation; indeed, using a modified version of SHARP, the inclusion of anisotropy was shown to enhance SAD phasing power (Schiltz & Bricogne, 2008).
The process of structure determination by MAD or SAD requires first an initial determination of the positions of anomalous scatterers, just as MIR or SIR phasing requires that the heavy-atom positions be determined before phase evaluations can proceed. Once the substructure is known, the amplitudes and phases from its associated diffracted waves can be used as interference references to find phases for the diffraction from the complete structure.
The information in appropriately conducted MAD experiments provides for a definitive analysis of the phase problem, as is embodied in Eqs. (4). We reduced this unified approach to practice in our initial application to lamprey hemoglobin (Hendrickson, 1985; Hendrickson et al., 1988) and then used it in our other early analyses. An instructive example is taken from the structure of the substrate-binding domain of selenomethionyl Hsp70 DnaK (Zhu et al., 1996). Here, the diffraction data from a four-wavelength MAD experiment were measured on imaging plates in successive iterations of wavelengths by wedges with mirror simultaneity of Bijvoet differences; and the data were analyzed by MADSYS in a ‘phase first, merge later’ strategy. The structure was refined at 2.0 Å resolution after model building based on a 2.3 Å resolution electron-density map, which in turn derived from a substructure determined at 3.0 Å resolution.
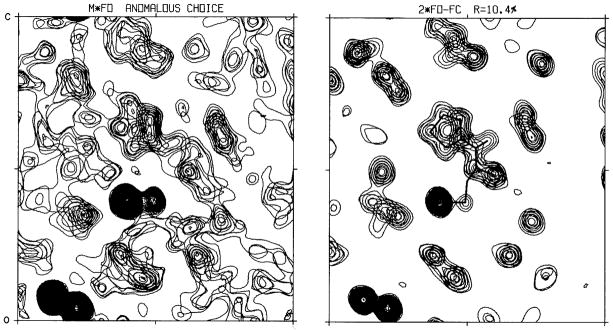
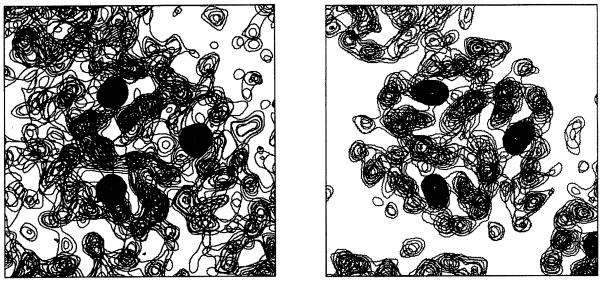
The multi-determination, ‘phase first’ approach for this DnaK structure gave MADLSQ statistics after mergers at 2.3 Å resolution of R (|°FT|) = 0.051, R (|°FA|) = 0.356, <Δφ> = 36.5° and <σ(Δφ)> = 17.2°, where Δφ = °ϕT − °ϕA. Before phase information given by the Δφ values can be used, the positions of anomalous scatterers, {rA}, are needed to derive the reference phases, °ϕA. The accurately determined |°FA| coefficients from MADLSQ gave a Patterson map for the selenium positions (Fig. 4a) that was readily interpreted by Patterson superposition program HASSP (Terwilliger & Berendzen, 1999) and validated by the corresponding |Fcalc| Patterson map from the deduced Se positions (Fig. 4b). The substructure thus deduced is unavoidably ambiguous, however: if a set of positions {rA} satisfies the |°FA| coefficients, its enantiomoph {−rA} also does so equally well. This ambiguity must be resolved, for if {rA} gives phases °ϕA, then {−rA} gives phases -°ϕA; and only with the correct choice will the phase solutions, °ϕT = Δφ + °ϕA, be useful. A statistical basis for resolving the enantiomorph ambiguity has proved elusive, but electron density maps derived from the alternatives are decisive when phase evaluations are accurate as they were here (<σ(Δφ)> = 17.2°). When the hand is correct (Fig. 5b), the density map shows clearcut molecular boundaries and structural features; whereas the map from the wrong hand (Fig. 5a) is without recognizable features.
Figure 4. Patterson maps for Se positions of DnaK substrate-binding domain (SBD).

(a) Map based on experimentally derived |°FA|2 coefficients. (b) Map based on the Se model derived from |Fcalc(6 Se)|2 coefficients. In each case the Harker section at w = ½ is shown, with density from data at 3.5 Å resolution.
Figure 5. Density distributions for DnaK SBD based on enantiomeric Se alternatives.

(a) Map based on phases derived from the Se substructure as determined by Patterson superposition methods, the (+) enantiomorph. (b) Map based on phases derived from the alternative Se substructure having each z coordinate changed to −z, the (−) enantiomoph. Each distribution was produced at 2.3 Å resolution, and each image includes equivalent slabs of sections at +z and −z, respectively.
Our unified analysis of MAD data, whereby |°FA| coefficients are extracted as in the DnaK analysis (Fig. 4), can provide a rigorous solution of the substructure problem. Such rigor is not essential, however; even the Bijvoet differences at a single wavelength suffice in many cases, and this is crucial for SAD phasing. The problem of finding anomalous scatterer positions was first solved by Rossmann (1961), who showed that positions for the anomalous scatterers could be obtained from a Patterson map based on (|F(h)| − |F(−h)|)2 coefficients. This approximation can be appreciated from Eq. (6), which shows ΔF±h to be directly proportional to |°FA| but reduced by sin(Δφ). Terwilliger (1994) showed that |°FA| estimates can be improved by the use of prior expectations, going toward correction for the trigonometric factor. Nevertheless, the vast majority of MAD and SAD substructure determinations simply use the Rossmann approximation. An important development for substructure determination has come from the direct methods approach, first applied in the analysis of selenomethionyl S-adenosylhomocysteine hydrolase (Turner et al., 1998) where the Shake-and-Bake (SnB) algorithm as applied to Bijvoet differences (Smith et al., 1998) found all 30 Se atoms. The SHELXD implementation (Schneider and Sheldrick, 2002) of the SnB algorithm (Hauptman, 1997) has been especially effective. In this approach, random starting structures are refined by iterations of tangent-formula refinement and real-space model adjustments against Bijvoet-difference estimates of |°FA|, using correlation-coefficient tests to find ‘solutions’ that stand out from the noise. Substructure determination from a native SAD application to intact DnaK-ATP (Liu et al., 2013) is shown in Fig. 6. Direct methods procedures were instrumental in extending the reach of MAD to large selenomethionyl proteins (Deacon & Ealick, 1999).
Figure 6. Profile of correlation coefficients (CCs) from a substructure determination.

The comparisons here are between observed Bijvoet differences from a TorT/TorS crystal and those calculated in SnB trials. The distribution of CCall and CCweak values is from 1000 SHELXD solution attempts. Successful solutions are colored red and random solutions are colored blue. Reproduced from Fig. 2G of Liu et al. (2012).
Phase evaluation itself can proceed once the anomalous substructure is known. Two distinct approaches are taken. In one, the unified formalism of Eq. (4) or Eq. (3) more generally, is used. The structure of anomalous scatterers serves to specify the associated °ϕA phases; and, subject to the enantiomorph ambiguity discussed above, an algebraic definition of the desired °ϕT phase can be obtained. In practice, especially since data sets are often incomplete, a more comprehensive description of the phase information is given by a probabilistic treatment (Pähler et al., 1990). Having determined the anomalous substructure, often from Bijvoet differences, |°FA| and °ϕA can be calculated and as an initial estimate |°FT| ≈ <|λiF(h)|2>; whereupon the joint probability distributions, P(|°FT|, °ϕT), can be produced and integrated to yield the best Fourier coefficients.
Alternatively, MAD experiments can be analyzed as in situ MIR experiments (Phillips & Hodgson, 1980), based on differences from physics instead of from chemistry. In this approach, data from one of the wavelengths is chosen as the reference data set, and differences are taken relative to these data. The first structure to be analyzed in a MAD-as-MIR approach was that of histone H5 (Ramakrishnan et al., 1993), and this method of analysis quickly took hold (Ramakrishnan & Biou, 1997). Various computer programs are used in MAD-as-MIR analyses, including MLPHARE (Otwinowski, 1991), SOLVE (Terwilliger & Berendzen, 1999), SHARP (de la Fortelle & Bricogne, 1997) and PHASES (Furey & Swaminathan, 1997). Although the unified and MAD-as-MIR approaches do often give similar solutions, they are distinguished, in principle, in that the structure factors at a particular wavelength, λF(h), correspond to a general density function (Hendrickson & Sheriff, 1987), which is complex due to anomalous scattering contributions, fΔ = f′ + i f″. The general density function may depart significantly from the true electron density function, which is purely real as determined by the structure factors due to normal scattering factors, f°. While often just a nuance, the distinction is not ignorable when anomalous scattering is large fraction of the total (e.g. Weis et al., 1991; Rudenko et al., 2002).
6. Evolution of SAD
Compared to the course of development for MAD, SAD emerged slowly and then accelerated remarkably after a gestation nurtured by MAD. An appealing characteristic of MAD phasing is its prospect for unambiguously definitive phase evaluations. In practice, this appeal of MAD for giving decisive answers was realized right from the first applications, even when the anomalous scattering signals were relatively weak. SAD carries much the same potential as MAD for decisive phasing, but this comes with a trigonometric ambiguity intrinsic to the basic phasing relationship of Eq. (6). SAD is like SIR in this respect, where incorporation of the orthogonal information from anomalous scattering into SIRAS resolves the phase ambiguities. MAD is the obvious resolving counterpart for SAD, giving the complementary phase information of Eq. (8). When such orthogonality is not feasible or ineffective, as when measurements are remote from absorption resonances, the resolution of phase ambiguity becomes a critical issue.
SAD experiments are a subset of MAD experiments. Although wavelength changes are not involved, tuning to a resonance edge or to exceptionally low energy is often used for signal optimization. Thus, synchrotron radiation is important even if not essential for SAD. Nearly all aspects of data measurement and analysis described above for MAD also carry over to SAD. What differs most is the need to add information beyond anomalous scattering to resolve the phase ambiguity.
6.1 Crambin and phase ambiguity
Crambin was the first macromolecular structure to be determined de novo from the diffraction data of a single crystal and it was the first to be analyzed without incorporating exogenous heavy atoms (Hendrickson & Teeter, 1981). Crambin is a very small protein (46 residues) and it diffracts exceptionally well (dmin < 0.48 Å; Schmidt et al., 2011); nevertheless, for its time it presented a substantial challenge. Sulfur SAD phasing was used to determine the structure, although the procedure was not identified then as SAD.
The diffraction data from a monoclinic crystal of crambin were measured at room temperature with Cu Kα radiation (sulfur f″ = 0.56 e) by single-counter diffractometry, one reflection at a time. Bijvoet differences were measured to 1.5 Å spacings. Care was taken to reduce systematic errors by measuring data in blocks of 25 reflections at (φ, ψ, 2θ) followed by the corresponding Friedel mates at (φ, ψ, −2θ) and by applying a parameterized local scaling before differencing. Care was also taken to use counting times sufficient to assure adequate counting statistics. The error level for the data set, taking into account a term for instrumental instability, was rms (σΔF) = 1.6e as compared to rms (ΔF±h) = 2.3e, which was 2.1% of rms (|F|). Bijvoet-difference Patterson maps were used to solve for the sulfur positions, first at 3 Å resolution where disulfide-bonded atoms are not resolved and then at 1.5 Å resolution to deduce the six-atom sulfur structure. Only the subset of 38% of reflections with strongest Bijvoet differences, where sin(Δφ) ≈ 1 so that |ΔF±h| gives |°FA(h)| directly, were used to refine the sulfur substructure.
From the Bijvoet-difference relationship used for the crambin analysis, Eq. (6), the phase ambiguity of SAD is evident. Once the general enantiomorph ambiguity is resolved, there still exists for each acentric reflection the ambiguity that °ϕT = °ϕA ± sin−1[2(f″A / f°A ) / |°FA|]. In terms of phase probability (Hendrickson, 1979), this in general presents a bimodal probability distribution (Fig. 7) although the distribution may be unimodal if the alternative phases are close to one another. A figure-of-merit weighted map with centroid phases will give the least error (Blow & Crick, 1959); such a map will still be inaccurate, however it can be improved greatly with appropriate resolution of the phase ambiguity. For the crambin analysis, phase information coming from the sulfur atoms was used for ambiguity resolution in a scheme for making choices between alternatives when the discriminative probability is high and for using multiplicative phase combination otherwise (Hendrickson, 1971; Fig. 7s). The sulfur partial structure here is relatively weak (<|°FA|>/<|°FT|> = 2.9%), however, and the resulting density map (Fig. 8) was poor compared with those from later MAD experiments (Figs. 3 & 5). This map did nevertheless prove to be interpretable into a well determined structure, thanks largely to the high resolution.
Figure 7. Scheme of options used for resolving phase ambiguity with crambin.

(Above) Bimodal ‘SAD’ probability distribution based on the Bijvoet difference for a particular reflection (Hendrickson, 1979). (Middle) Partial structure probability distribution based on the sulfur substructure. (Below) Options of multiplicative phase combination of the top two profiles (‘COMBINE’) or choice of the symmetrized modal distribution (Hendrickson, 1971) corresponding to the ‘SAD’ alternative, φ1, that has partial-structure probability significantly higher than for the lesser alternative, φ2 (‘CHOOSE’).
Figure 8. Electron density maps from the structure analysis of crambin.
(Left) Experimental map with ‘SAD’ phases resolved by the partial-structure anomalous-choice procedure. (Right) Model-phased (2Fobs – Fcalc) map from the final model refined at 1.5 Å resolution. The portion shown in these frames includes the disulfide-bonded sulfur atoms from Cys16-Cys26 at lower left, Sγ of Cys32 near the center and disulfide-bonded to Sγ of Cys4 (mostly out of the section), and the five-membered ring of Pro5 just above center. Reproduced from Fig. 2 of Hendrickson & Teeter (1981).
The partial-structure resolved anomalous phasing method was used for a few other analyses (Conner et al., 1982; Smith et al., 1983; Sheriff et al., 1987), but such approaches were quickly overwhelmed by the growing successes of MAD phasing.
6.2 Ambiguity resolution from density modification
If only by comparison with the decisiveness of MAD, it became apparent that anomalous substructures alone are not generally adequate for effective resolution of phase ambiguity in single-wavelength anomalous phasing experiments. A striking example came with the application to a trimeric hemerythrin (Smith et al., 1983) where the di-iron sites of this metalloprotein were used in resolved anomalous phasing to obtain an initial map, which was inadequate for interpretation on its own but was improved dramatically by three-fold molecular averaging and ‘solvent leveling’, as it was then described (Fig. 9). Similarly dramatic enhancements from symmetry averaging had been seen in the structure analysis of influenza virus haemagglutinin (Wilson et al., 1981). Non-crystallographic symmetry clearly provides a powerful means form ambiguity resolution, but it is not a general solution.
Figure 9. Electron density maps from the structure analysis of trimeric hemerythrin.
(Left) Experimental map with ‘SAD’ phases resolved by the iron partial structure. (Right) Experimental map after refinement by iterative three-fold molecular averaging and solvent leveling.
A general and powerful solution came with the innovation of procedures for molecular envelope definition and solvent flattening (Wang, 1985). As applied to anomalous scattering problems, this procedure was called the iterative single-wavelength anomalous scattering (ISAS) method, and as such its first application to an unknown was to a neurophysin-dipeptide complex using an iodinated derivative (Chen et al., 1991). A second application of this kind was made in the corrected analysis of Cd, Zn metallothionein (Robbins et al., 1991). A direct methods approach to ambiguity resolution, called one-wavelength anomalous scattering (OAS), was also devised and tested (Fan et al., 1985); and this procedure was used in an application to the copper protein rusticyanin (Harvey et al., 1998). Phases for rusticyanin from the OAS procedure were not sufficiently accurate to produce a readily interpretable map (Harvey et al., 1998); however, refinement with density modification as implemented by Cowtan and Main (1993) did produce the structure. Direct methods by way of Sayre’s equation had also been ineffective in the crambin study (Hendrickson & Teeter, 1981).
Density modification continued to develop after Wang’s introduction of solvent flattening (1985) with the incorporations of histogram matching (Zhang & Main, 1990), the systematic inclusion of molecular averaging (Cowtan & Main, 1993), the innovation of solvent flipping (Abraham & Leslie, 1996), the introduction of maximum-likelihood (Terwilliger, 2000), and with varied implementations as reviewed by Cowtan (2010). Another noteworthy addition to crystallographic practice with relevance to the interpretability of density maps was the introduction of automated chain tracing with the program ARP/wARP (Perraskis et al., 1999) and successors such as RESOLVE (Terwilliger, 2003a,b) and BUCCANEER (Cowtan, 2006). With these advances in computational procedures, the trigonometric phase ambiguity of single-wavelength anomalous diffraction could be resolved to extract the intrinsic phase definition of careful experiments.
6.3 SAD becoming the method of choice
As density modification procedures were implemented and the resulting power for effective ambiguity resolution was recognized, new opportunities became apparent and additional single-wavelength anomalous analyses were performed (Biou et al., 1995; Turner et al., 1998). Then, using hen egg white lysozyme as a test system, Dauter and co-workers showed that density-modification resolved phasing could be effective when based on atoms intrinsic to the structure (Dauter et al., 1999) or based on introduced bromide atoms (Dauter & Dauter, 1999). The intrinsic-atom study (sulfur and chlorine) was performed at the wavelength of Cu Kα to emphasize that crambin-like analyses well away from absorption edges would now be straightforward, and this analysis used a combination of programs SHELXM (Sheldrick, 1998), SHARP (de la Fortelle & Bricogne, 1997) and SOLOMON (Abrahams & Leslie, 1996). The bromide ion studies were performed at or near K-edge resonance, and this analysis used a combination of SHELXM (Sheldrick, 1998), DM (Cowtan, 1994) and MLPHARE (Otwinowski, 1991). A key validation of the potential for sulfur SAD phasing came in the structure determination of obelin (Liu et al., 2000), which was performed at a wavelength of 1.74 Å and used a combination of SOLVE (Terwilliger & Berendzen, 1999) and PHASES (Furey & Swaminathan, 1997) to find the sulfur sites and the ISAS solvent flattening (Wang, 1985) for phase evaluation.
Even earlier, the PDB deposition for a green fluorescent protein (GFP) structure (Ormö et al., 1996) provided, to my knowledge, the first recorded use of the SAD acronym in citing “MIR/SAD” as the method of determination to describe an analysis of selenomethionyl GFP. SAD was also used in the Dauter papers on using sulfur and bromine as anomalous scatterers, but this was done off-handedly as if the term were already commonplace. It was used again in reporting the structure of psoriasin (Brodersen, 2000) and in a re-evaluation of seven structural analyses of selenomethionyl proteins (Rice et al. 2000). In the latter study, two structures were SAD phasing rescues for MAD phasing failures, spoiled by radiation damage; for the other five cases, the maps from density-modified SAD phases were nearly as good as those from MAD phases. With this background, Dauter et al. (2002) then presented a defining mandate for SAD that reviewed the method and described fifteen tests and novel applications.
The growing successes of SAD spurred a renewed interest in home-source experiments (Yang & Pflugrath, 2001; Nagem et al., 2005), notably employing x-rays generated from a chromium anode to better exploit sulfur anomalous scattering (Yang et al., 2003; Kitago et al., 2005) or to take advantage of the anomalous scattering from iodine as its LI edge is approached (Evans & Bricogne, 2003). Nevertheless, synchrotron radiation provides compelling advantages; fine tuning of x-ray energy makes it possible to optimize the strength of f″ at the Se K-edge and other resonance peaks, and access to lower x-ray energies permits the enhancement of anomalous signals from low-Z elements such as sulfur since f″ values increase as these K-edges are approached (Weiss et al., 2001). The synchrotron advantage for selenium is responsible for most of the surge in selenomethionyl SAD structures documented below and the low-energy advantage is beginning to have an impact for sulfur SAD structures as multi-crystal experiments are developed.
6.4 Multi-crystal enhancement of signal-to-noise ratios
Although SAD has become the method of choice for de novo phase evaluation in crystallographic structure determination, it has remained relatively ineffective for challenges where diffraction is poor or signals are too weak. A recent analysis of SAD-phased structures in the Protein Data Bank (PDB) found only a small fraction to be at low resolution or to be based on native, low-Z elements (Liu et al., 2013). Among the 5286 identified SAD entries as of April 2012, only 32 structures were at low resolution (dmin ≥ 3.5Å) and only 58 structures were based only on light atoms (Z ≤ 20). Moreover, the only-light-atom (sulfur SAD) structures were at relatively high resolution: 74% at higher than 2 Å resolution; all at higher than 2.3 Å resolution. While the limited output of structures from low-resolution and only-light-atom SAD experiments might be due to a scarcity of such applications, it seemed more likely to have reflected complications from feeble anomalous signals embedded in noisy diffraction data.
We hypothesized that success with challenging SAD experiments could be improved by increasing the multiplicity of measurements; thereby, the enhancement in signal-to-noise over that from a single measurement is expected to be √M where M is the multiplicity. Such improvements had been demonstrated for phosphorous SAD from a relatively large crystal of a DNA oligomer (Dauter & Adamiak, 2001); however, more typical macromolecular crystals cannot sustain multiple cycles of measurement without unacceptable radiation damage. Averaging from multiple crystals is an obvious solution; however, with cryoprotection, macromolecular crystallography had devolved into the search for one good crystal. Usually, one frozen crystal sufficed, and this was seen as preferable to multi-crystal averaging because crystal variation was expected due to stochastic lattice changes with flash freezing. For multi-crystal SAD experiments, it was thus important to assure that only crystals with statistically equivalent diffraction would be included. Clustering tests for such assurance were devised based on lattice dimensions, overall intensity patterns, and anomalous diffraction profiles (Liu et al., 2012). Figure 10 exemplifies such clustering.
Figure 10. Variations among crystals from a multi-crystal data set.

(Left) Pairwise cluster analysis of unit cell variations. (Center) Pairwise cluster analysis of overall intensity variations. (Right) Relative anomalous correlation coefficient comparing Bijvoet differences from each crystal to those from the average of all together. Crystal 8 was eliminated as an outlier from the distribution, but the others were judged to be statistically equivalent and included for structure determination. Adapted from Fig. 1 of Liu et al. (2012).
The idea of multi-crystal SAD phasing was tested first with selenomethionyl protein crystals at low resolution. We used the large extracellular domain of a histidine kinase receptor, which formed crystals that diffracted only to 3.5 Å Bragg spacings. With two copies in the asymmetric unit, this structure proved to be challenging in size as well as resolution; there proved to be 1456 ordered residues and 20 Se sites. Both the success in Se-substructure determination and the accuracy of resulting phase evaluations improved with the increasing multiplicity in diffraction from multiple crystals (Liu et al., 2011). A particularly common instance of low-resolution selenomethionyl problems is found with crystals of detergent-solubilized membrane proteins, and the multi-crystal approach has now proven successful for a number of selenomethionyl membrane proteins at low resolution (Mancuso et al., 2012; Ardiccioni et al., Submitted.).
The challenge of only-light-atom native SAD analyses provided the second motivation for multi-crystal SAD experiments, and the methodology for such applications has also been described recently (Liu et al., 2012; Liu et al., 2013). Five structures were determined in these tests, which used 5 to 13 crystals, included 4 to 52 anomalous scatterers, comprised 127 to 1200 ordered protein residues per asymmetric unit, and ranged in resolution from 2.3 Å to 2.8Å.
Procedures were devised to make multi-crystal native SAD phasing robust and routine. First, it was in these applications that clustering procedures were devised to assure statistical equivalence of crystals admitted into averaging, employing tests on unit-cell deviations, diffraction dissimilarity and relative anomalous correlation coefficient (Fig. 10). As addressed above and advocated previously (Weiss et al., 2001; Yang et al., 2003), enhanced f″ signals are expected at lower x-ray energy. We used the moderately low energy of 7 keV for our initial studies (Liu et al., 2013) since all of those crystals were relatively large; nevertheless, the use of a helium cone proved to be critical for the most challenging case (histidine kinase TorT/TorSS with 1148 residues and diffraction limited to 2.8 Å spacings). Standard data reduction and scaling procedures were adopted, but with care to avoid including radiation-damaged frames. The enhancement in signal-to-noise was especially evident in the improvement of anomalous correlation coefficients (CC for randomly split ΔF±h data) for data after merging compared to those from each individual crystal (Fig. 11). Substructures were determined using the shake-and-bake procedure of SHELXD (Hauptman, 1997; Schneider and Sheldrick, 2002). Initial phases were evaluated by Phaser (Read & McCoy, 2011), density modification was performed with DM (Cowtan & Zhang, 1999), and initial atomic models were built automatically with ARP/wARP (Langer et al., 2008).
Figure 11. Enhancement of anomalous signal-to-noise by multi-crystal averaging.

Anomalous correlation coefficient (Anomalous CC) profiles as a function of Bragg spacings, comparing Bijvoet differences from five individual data sets with the data set compiled by averaging from all five. For individual DnaK-ATP data sets, the signal is essentially undetectable beyond 4.5 spacings and is at the 20% level down to ~5 Å spacings; for the averaged data set, the signal is retained at the 20% level out to 3.5 Å spacings. Reproduced from Fig. 4a of Liu et al. (2013).
Four of the five structures analyzed in our initial multi-crystal native SAD experiments were novel, and the results from three of these are now in publication (Brasch et al., 2011; Qi et al., 2013; Assur et al., “submitted”). Meanwhile, we and others have solved other structures by multi-crystal native SAD procedures, and two of these are also in publication (Akey et al. (2014); Chang et al., Submitted).
We anticipate that multi-crystal SAD procedures will have broad application to native macromolecules without recourse to heavy-atom incorporation (Liu et al., 2013). The initial set of applications included structures as large as 1200 amino-acid residues and at resolutions as limited as 2.8 Å. These are properties shared by 90% of current PDB holdings. Anticipated advances in synchrotron instrumentation and automation should facilitate making such experiments routine.
7. Applications and changing practice
At the outset, when MAD was instigated in the mid-1980s, such experiments were considered rather exotic and even heroic; moreover, the need for a new approach to de novo structure determination was then questionable in light of historic success with MIR and SIRAS. Ensuing applications showed convincingly that MAD was practical and that it could be the approach of choice for challenging structures. MAD was energized by technical innovations, notably cryopreservation and selenomethionyl proteins, and it flourished at beamlines designed expressly for MAD. MAD had displaced MIR as the predominant de novo method; then, as density modification procedures were perfected, SAD surpassed MAD. This section takes stock of current applications of anomalous diffraction in biological crystallography and changing practice in de novo structure determination
7.1 Realms of application
The domain of MAD and SAD is nearly as broad as the periodic table itself. Each element has its distinctive resonant energies; and, as noted above in section 5.2, all elements from Ca (Z=20) to U (Z=92) have K or LIII resonances in the energy range from 3.5 to 35 keV (3.5 to 0.35 Å in wavelength). Indeed, with specialized beamlines, the range can be extended down to 2.1 keV (5.8 Å) to include the K resonances from phosphorous and sulfur (Stuhrmann et al., 1997). Moreover, off-resonance f″ strength often suffices for SAD based on elements with resonances outside of accessible x-ray energies, which in practice may be restricted (e.g. 6 to 17 keV / 2.1 to 0.7 Å). This opens significant opportunities for SAD with elements in the range 15 ≤ Z ≤ 24, where K-edge strength can be approached, and 40 ≤ Z ≤ 59 where L-edge strength can be approached. Success with sulfur SAD is a case in point. Indeed, even the anomalous scattering from oxygen can be used for structural characterization (Hope & de la Camp, 1972).
With the sensitivity of anomalous diffraction and the wide-open options for useful elements, versatility abounds. All of the conventional heavy-atom derivatives, such as those with U, Hg, Au, Pt and Os are also ideal for MAD and/or SAD; intrinsic metal centers, including many first-series transition elements such as Fe, Cu and Zn as well as Mo and W from higher series, make almost all metalloproteins natural candidates; many lighter ions have ready and potent replacements, e.g. PO42+ by WO42+, SO42+ by SeO42+, and Ca2+ or Mg2+ by a lanthanide such as Yb3+; and there are several robust means for systematic incorporation. The most notable systematic approach is with selenomethionyl proteins (Hendrickson et al., 1990; Doublié, 2007); other possibilities include the synthesis of brominated or selenated nucleic acids (Sheng & Huang, 2011), the quick-soaked adsorption of solvent ions such as the halides Br− and I− (Dauter & Dauter, 2001) or cations Cs+ or Gd3+ (Nagem et al., 2001), or the pressurized binding of noble gases Kr and Xe into hydrophobic cavities (Schiltz et al., 2003).
Endowed with this rich armoury of phasing elements, biological crystallographers have expeditiously solved thousands of de novo macromolecular structures. These applications are from the complete range of biochemical systems, having in common only the need for de novo structure determination. Because of this bias toward novelty, the resulting MAD and SAD structures have often broken new ground for biological discoveries and structural precedents. Instances of application include metabolic enzymes [e.g. NO synthase (Raman et al., 1998); HMG-CoA reductase (Istvan et al., 2000)], DNA replication and repair systems [e.g. clamp-loader complex (Jeruzalmi et al., 2001); RecA:DNA recombination complex (Chen et al., 2008); DNA polymerase η : DNA (Biertümpfel et al., 2010)], transcription factor complexes [e.g. TBP:TFIIA:DNA complex (Geiger et al., 1996); NFAT:Fos/Jun:DNA (Chen et al., 1998); nuclear receptor PPARγ-RXRα:DNA complex (Chandra et al., 2008)], RNA molecules [e.g. P4–P6 self-splicing intron (Cate et al., 1996), RNase P ribozyme:tRNA complex (Reiter et al., 2010)], signaling proteins [e.g. insulin receptor kinase (Hubbard et al., 1994); EGF receptor ectodomain (Cho & Leahy, 2002)], cytoskeletal proteins [Arp 2/3 complex (Robinson et al., 2001); centriolar hub protein SAS-6 (Kitagawa et al., 2011)], viral proteins [e.g. HIV integrase (Dyda et al., 1994); papilloma virus E2 protein (Harris & Botchan, 1999)], vesicle transport proteins [SNARE complex (Sutton et al., 1998); coatamer cage complex (Lee & Goldberg, 2010)], molecular chaperones [e.g. trigger factor (Martinez-Hackert & Hendrickson, 2009; Hsp70 DnaK (Qi et al., 2013)], membrane transporters [neurotransmitter transporter homolog LeuT (Yamashita et al., 2005); P-glycoprotein (Jin et al., 2012)], and ion channels [stomatal anion channel (Chen et al., 2010); voltage-gated sodium channel (Payandeh et al., 2011)]. There are many more instances for these and other categories of application. Notable among them are high-significance challenges such as the first crystal structures of ribosomes [70S (Cate et al., 1999); 30S (Wimberly et al., 2000)], transcriptional RNA polymerase (Cramer et al., 2001), and the G-protein coupled receptors rhodopsin (Palczewski et al., 2000). From these precedents, other structures have followed by molecular replacement.
In addition to addressing the broad spectrum of structural biology associated with the biological projects of individual investigators, MAD and SAD also became instrumental in the development of the higher throughput approaches of structural genomics. The then newly realized efficacy of selenomethionyl MAD analysis of protein structure was a founding rationale for the structural genomics approach whereby structural representatives are sought for each sequence family in the protein universe (Shapiro & Lima, 1998). De novo structure determination is essential here since the focus is on sequences without known structures, and selenomethionyl MAD crystallography seemed most expeditious. Indeed, selenomethionyl proteins became a mainstay for the protein production pipelines of all four large-scale centers of the NIH Protein Structure Initiative (PSI): JCSG (van den Bedem et al., 2011), MCSG (Kim et al., 2011), NESG (Xiao et al., 2010) and NYSGXRC (Bonanno et al., 2005); however, as for the world more generally, SAD came to be preferred over MAD. Over the ten-year period of the PSI protein-universe effort, PSI-1 and PSI-2, 5097 atomic structures were deposited into the Protein Data Bank, of which 4598 (90%) were crystal structures. These crystal structures included 1353 (29%) done by MAD and 2168 (47%) done by SAD.
In addition to the direct impact of anomalous diffraction in de novo structure determination, as exemplified by applications described above, ancillary benefits often accrue as well. First, the sites of anomalous scatterers can provide precise landmarks to assist in chain tracing at resolutions too low for clear residue identification for sequence alignment. This is particularly true for selenium sites marking the positions of methionine residues. There are many notable examples of such utility (e.g. Wu et al., 1997; Sawaya et al., 2008; Pomeranz Krummel et al., 2009; Feng et al., 2010; Jin et al., 2012), including cases where methionine sites are introduced strategically by mutation (Leahy et al., 1994). Second, information from anomalous diffraction measurements can be coupled usefully with molecular replacement. In favorable situations, the sites of anomalous scatterers can be used to specify the translational positioning, or even the orientation, of a known structure into the subject crystal [e.g. Bes et al. (1999)]. More typically, when at least some part of a structure can be approximated by a replacement model, SAD phasing may be incorporated to remove phase bias and to define unmodeled portions of the structure. Indeed, in cases where the anomalous substructure is not readily solved, a molecular replacement solution may produce a readily interpretable Bijvoet-difference Fourier depiction of anomalous-scatterer positions. Combinations of molecular replacement with SAD, often called MR-SAD (Schuermann & Tanner, 2003; Panjikar et al., 2009; Read & McCoy, 2011), have become increasingly common; since 2009, 88 SAD structures (3%) included an MR component. Third, the element specificity of anomalous scattering provides a basis for unambiguous identification of ion sites. Classically, this has been done by taking measurements at diagnostic energies above and/or below that for an element in question. When the element in question has no resonance within the accessible energy range, ionic replacements have sometimes been used, such as Rb+ or Tl+ for K+ (Zhou & MacKinnon, 2003) or Os(III) hexamine for Mg2+ hydrates (Kazantsev et al., 2009). Alternatively, we have shown that robust identifications can also be made through the refinement of f″ values against Bijvoet mates (Liu et al., 2013), especially for data measured at a low x-ray energy. Fourth, the definitive character of MAD phasing can lead to experimental phases with exceptional accuracy, and this can be useful in providing model-free pictures of solvation, motion and conformational heterogeneity (Burling et al., 1996). Accurate experimental phases from MAD phasing are particularly useful for analyses at low resolution (Rudenko et al., 2002; Bass et al., 2002).
7.2 Changing practice in de novo phase evaluation
The early history of macromolecular crystallography related almost entirely to de novo structure determination done by MIR. All structures presented at a watershed Cold Spring Harbor meeting in 1971 (Watson, 1972) either came directly from MIR (some reinforced with anomalous scattering, i.e. MIRAS or SIRAS) or were from difference-Fourier analyses of isomorphous ligand complexes. The first textbook on protein crystallography (Blundell & Johnson, 1976) treated MIR extensively; however, while it gave excellent discussions of anomalous scattering and molecular replacement, there was almost nothing to report in practice. The emphasis for molecular replacement, as in the monograph by Rossmann (1972) by this very name, was on solving for phases from symmetry transformations. Molecular replacement as we know it now, for repositioning a known structure into the crystal of a relative, was mentioned only in citing a test at 5 Å resolution on seal myoglobin (Tollin, 1969). As recounted above, it was not until 1981 that anomalous scattering was shown to suffice on its own for biological structure determination (Hendrickson & Teeter, 1981), introducing what we now call SAD. MAD followed in 1985 (Hendrickson, 1985; Kahn et al., 1985), but it took time for it to develop (Hendrickson, 1991).
Meanwhile, structure determination practices were changing rapidly. By the time that MAD was emerging, structures by de novo methods were already the minority fraction. We know this from statistics in our Macromolecular Structures (MS) series (Hendrickson & Wüthrich, 2000). Starting in 1990 and on for a decade, through 1999, we compiled annual MS books of abstracts for structures meeting criteria of (1) having an atomic model, (2) being experimentally derived, (3) being novel and (4) being macromolecular. MS 1991 (Hendrickson & Wüthrich, 1991), reporting structures published in 1990, described 135 structures meeting the MS criteria as compared to 236 PDB depositions in total (57%); the remainder were from follow-up studies that had failed the novelty test, mainly as being ligand complexes or mutant variants of previously deposited structures. Already by 1990, the majority of MS-qualified x-ray structures (57/111) were determined by molecular replacement; among the 51 de novo structures, there were 78% by MIR (40), 12% by SIR (6), 8% by MAD (4) and one virus by ab initio molecular averaging. By 1999 (MS 2000), the number of MS-rated structures had risen to 929 but as a fraction of all PDB entries it had fallen to 36%. Among MS-rated x-ray structures, again a clear majority were determined by molecular replacement (58%) but the breakdown of de novo strutures was evolving to an increasing fraction done by MAD (Fig. 12).
Figure 12. Distribution of macromolecular structures of 1997 by determination method.
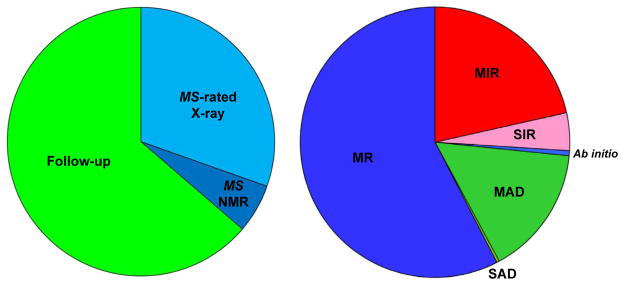
(Left) Pie chart showing distribution among MS-rated (novel) and follow-up structures. (Right) Pie chart of MS-rated x-ray structures as divided among molecular replacement structures and de novo structures as determined by various methods.
To chronicle the evolution of MAD phasing applications, I undertook to produce a record of all published MAD structures meeting the MS criteria. An account of the progression through 1998 showed a slow start (1 to 4 entries per year during 1988 – 1993) followed by an exponential rise to 58 in 1998 (Hendrickson, 1999). This compilation was continued through 2001 (Fig. 13; Supplemental Table 1), at which point the growing flood of MAD structures became overwhelming (260 recorded for 2001); indeed, some might have been missed. Moreover, SAD structures were becoming numerous (21 for 2001); and a separate chronicle was developed for SAD, retrospectively including earlier off-resonance anomalous diffraction structures (Supplemental Table 2). In compiling structural results from the publications, rather than PDB entries, it was possible to glean experimental details on the x-ray source and phasing element. The breakdown on x-ray beamlines (Supplemental Table 3; Hendrickson, 1999; Hendrickson, 2000) showed that by 2001 novel MAD and SAD structures had been determined at 44 different beamlines from 13 synchrotrons and also from CuKα sources. The breakdown on phasing elements shows coverage across the periodic table (Fig. 14; Supplemental Table 4; Hendrickson, 1999). These MAD and SAD experiments reflect all of the categories of application described above in section 7.1; however, not surprisingly, the distribution is far from uniform. Most notably, Se predominates (66% overall); however, the conventional heavy atoms (Hg, Pt, Au, Os), the transition metals of metalloproteins (Fe, Cu, Zn), and bromide ions and brominated nucleic acids (Br) also showed appreciable fractions at 13%, 10% and 5%, respectively. Besides the phasing elements used in MAD and SAD structures through 2001 (Supplemental Tables 1 & 2), a few others that have been used subsequently (identified in Supplemental Table 5) are also included in the periodic chart (Fig. 14) but not in the bar graph.
Figure 13. Early growth in the production of anomalous diffraction structures.

The number of structures based on MAD or SAD phase evaluation, published in a given calendar year, and meeting the criteria for inclusion in Macromolecular Structures (MS-rated; Hendrickson & Wüthrich, 1991) is plotted year by year. Structures included here are identified in Supplemental Tables 1 & 2 and the statistics are summarized in Supplemental Tables 3 & 4. MAD structures are in solid black and the SAD structures are in open boxes. Updated from Fig. 1 of Hendrickson (1999).
Figure 14. Distribution of phasing elements used in anomalous diffraction analyses.

The numbers of MS-rated (Hendrickson & Wüthrich, 1991) MAD or SAD structures published through 2001 (Supplemental Tables 1 & 2) are plotted as a function of the atomic numbers of elements used in those phase evaluations (Supplemental Table 4). If an analysis used more than one anomalous element, all are included. A logarithmic scale (log2) is used because of the great disparity between numbers for Se and other elements (Se:Hg ≈ 8 ; Se:Fe ≈ 10). Atomic numbers having N=1 are distinguished from those with N=0 (logN indefinite) by small bars. The periodic table shown as an inset identifies elements that have been used for novel structure determinations by MAD or SAD phasing. Elements are colored green if any reported analysis included measurements made at resonance, whether by MAD or SAD; elements are colored yellow if only off-resonance measurements were used in the reported analyses. Elements first used in studies published after 2001 (Cl, Ca, Mn, Sr, Pd, Ba, Nd and Pr) are identified in Supplemental Table 5.
An alternative approach to the tracking of trends in structure determination became available when, starting in 1996, the PDB began to include details of the kind that were being abstracted into MS entries. To retrieve information of interest from PDB header records, we developed a parser for extracting and categorizing the depositor declarations on “method used to determine the structure.” We sorted those entries from de novo determinations into MIR, SIR, MAD, SAD and ab initio categories, including variant descriptors such as MIRAS, SIRAS, SE-MET MAD PHASING, SAS, or DIRECT METHODS, respectively, into these groupings. The progression of changing practice in de novo structure determination is illustrated in Figure 15. Three things are notable. First, over this period of record, the total number of de novo structures grew dramatically from an annual average of ~300 in the span from 1997–2000 to nearly 1400 ten years later in the span from 2007–2010. The drop to ~1100 de novo structures per year in the last two full years can be ascribed to the ending of the high-throughput phase of PSI; whereas annual PSI output of SAD plus MAD structures averaged 597 during 2007–2009, this dropped to 521 in 2010 (transition year between PSI-2 and PSI:Biology) and then to 230 on average during PSI:Biology years 2011–2012. Second, promoting the growth in total de novo structures, there was a dramatic shift in market share from analyses by isomorphous replacement (MIR and SIR, reddish bars) to analyses by anomalous diffraction (MAD and SAD, greenish bars) analyses. At the start of the period, 80% of de novo structures were done by MIR or SIR; whereas a decade later, nearly 90% were done by MAD or SAD. Already by 2000, more structures were done by MAD than by MIR and SIR combined. Third, SAD now predominates altogether. SAD overtook MAD in 2006, and now nearly 70% of all de novo structures are SAD structures.
Figure 15. Changing practice in de novo structure determination.

Depositor declarations for the method of structure determination were parsed from PDB entries beginning in 1997, the first full year for such recordings. Declarations judged to be synonymous were reduced to five de novo options; thus, for example, MIR includes MIRAS determinations, SIR includes SIRAS, and ab initio includes ‘direct methods’. Numbers were normalized into percentages of total de novo determinations in each year, and plotted in histograms identified by color coding. Multiple declarations (e.g. SIR and MAD) were counted for each method, but there were few such instances. The total number of de novo structures is plotted year by year as identified; 2013 is excluded because of incompleteness. Results here are from the PDB holdings of 10 December 2013. Updated and elaborated from Fig. 3 of Hendrickson (2013).
I estimate that, over all of biological crystallography through 2012, 77% of the x-ray crystal structures determined by de novo methods were done by MAD or SAD. For the period of 1960–1996 (from atomic-level myoglobin until PDB deposits came to include methods records), I estimate that 430 MS-rated structures were done by MIR and SIR. This number is deduced by starting from our estimate of 2,346 total x-ray structures through 1996 (Hendrickson & Wüthrich, 2000), assuming a de novo fraction (21.6%) as found for 1990 (MS 1991), subtracting the 67 MAD and 7 SAD structures recorded from publications (Supplemental Tables 1 & 2), and neglecting ab initio structures. For the period of 1997–2012, based on PDB records, the integrated totals for MAD and SAD (11,395 for 79.6%) are much larger than those for MIR and SIR (2,604 for 18%). By summing over the two periods, I arrive at the 77% estimate for MAD and SAD overall. A small but steady residual fraction (~3% overall) of de novo structures have come from ab initio methods. It should be noted that another small fraction of de novo determinations (less than 1%) have made use of multiple de novo methods (mainly MAD + MIR). Of course, nearly all current de novo structure determinations take advantage of density modification, and some also include molecular replacement information. That said, generally speaking, MAD and SAD are self-sufficient and reliably effective methods. Indeed, that effectiveness was clearly such as to motivate the community to adopt MAD and then SAD as methods of choice. Associated with this shift in behaviour, the increases from MAD and SAD after 2000 correlate with a concomitant growth in total de novo structure determinations (Fig. 15), which is consistent with efficiency of the anomalous diffraction approach.
7.3 Future prospects
Anomalous diffraction has moved from being ancillary to predominating for de novo structure determination, and this dominance seems likely to continue for some years. Indeed, it is difficult to imagine what might overtake SAD. An advance in ab initio methods could happen, but there is no evidence in the historical record (Fig. 15) for incipient ascendency; moreover, theoretical and practical limitations on size and resolution complicate broad applicability. Molecular replacement will doubtless continue to advance as more ‘knowns’ become available to serve as templates and improved methods permit the detection of ever smaller portions of unknown structures. Still, truly novel structures will demand de novo phase evaluation, and many of these structures are likely to present crystallographic challenges.
The frontier for MAD and SAD technology lies in efficaciously tackling small crystals of large, radiation-sensitive molecular systems that diffract no better than to moderate resolution. Progress with such challenges will likely need one or another improvement: sound analytical procedures to address extremes of both very weak and extraordinarily large signals, enhancement of anomalous signals such as from low energy x-rays, possibly a new generation of phasing vehicles, enhancement of signal-to-noise ratios as from multiple crystals, improved computational procedures for handling data from multiple crystals, appropriate instrumentation for advanced x-ray sources and the presentation of small crystals, and appropriate applications to test the limits. Many applications will benefit from a coordinated implementation of multiple methodological improvements.
One challenging area where advanced methods might contribute concerns structure determination at low resolution, where atomic models are ill-specified. Solvent flattening approaches lose effectiveness at lower resolution, which makes accurate ambiguity resolution for low resolution SAD structures problematic (although molecular averaging remains highly effective). On the other hand, properly performed MAD experiments can yield highly accurate phases (Burling et al., 1996) whenever the anomalous sites can be determined accurately. Situations are becoming commonplace where even best crystals diffract poorly (dmin ~4 Å); examples include membrane proteins (Bass et al., 2002; Nyblom et al., 2013), receptors (Rudenko, 2002), flexible multi-domain proteins (DeLaBarre & Brünger, 2003; Leonard et al., 2011), and multi-component complexes (Ataide et al., 2011). Accurate structures at much lower resolution (~6Å) have proved to be highly informative, as was true for the globins (Kendrew et al., 1958; Perutz et al., 1960) and hemerythrins (Hendrickson et al., 1975; Ward et al., 1975; Smith et al., 1983), and similar studies are likely to become important once again where intrinsic resolution is very limited.
Many low resolution structures are from rather large systems, which in turn require strong anomalous scatterers for accurate phasing. An effective approach to strong anomalous signals has come through heavy-metal cluster compounds (Thygesen, 1996; Knäblein et al., 1997), which scatter as super-atoms when viewed at low enough resolution (dmin > 4Å). This can be a great boon to structure determination; e.g. we estimate that the complex of a Au102-gold cluster compound (Jadzinsky et al., 2007) attached 4:1 to a 2.3 MDa tetramer of 5000-residue protein chains will produce Bijvoet-diffraction ratios (Eq. 9) of 110%. Signals of such strength will overpower many conventional phasing programs; indeed, complications were already noted from a tungsten-cluster complex with the LDL receptor (Rudenko et al., 2003). On the other hand, the exact MAD treatment (Eqs. 4–7) can handle such colossal MAD signals readily, as was demonstrated for the very large (~27%) Ho LIII signals from the mannose-binding protein (Weis et al., 1991). Colossal cluster compounds can also be used at resolutions beyond the super-atom level; however, the cluster must then be resolved into its constituent atoms, and procedures have been described for doing so (Dahms et al., 2013). Moreover, the low resolution phases can be used in difference Bijvoet-difference analyses to find the potential sites of anomalous scattering in a very large structure, as for selenomethionyl proteins, halide soaks, or some heavy-atom derivatives.
Heavy-atom cluster compounds are important as new phasing vehicles, as noted above, but other directions are in progress as well. Selenated compounds alternative to the predominating selenomethionine have also been introduced by biological synthesis into proteins, using selenatryptophan analogs of tryptophan (Bae et al., 2001; Boles et al., 2002) or selenocysteine to generate cystine-like diselenides (Strub et al., 2003), and by chemical synthesis into nucleic acids (Sheng & Huang, 2010). Chelating frameworks for incorporating lanthanide ions (Purdy et al., 2002; Girard et al., 2003) provide potentially effective means for introducing these potent anomalous centers. Uranyl compounds can provide spectacular anomalous signals (Fig. 1b; Liu et al., 2001) and chelated delivery for such phasing vehicles might also be made possible. No doubt, other possibilities will emerge.
Another challenging category of application concerns native structures that are composed only from light atoms. Here the multi-crystal native SAD approach described above in Section 6.4 becomes important. The anomalous signals from the intrinsic sulfur and phosphorous atoms in biological macromolecules can be enhanced remarkably by using low energy x-rays (Liu et al., 2013). This enhancement comes about as the K (1s) resonances for S and P atoms at 2.472 keV (5.016 Å) and 2.1455 keV (5.779 Å), respectively, are approached. Thus, f″ signals increase with lower energy; however, so too does x-ray absorption and background scattering. Indeed, x-ray penetration depth decreases with energy such that the transmitted signals actually diminish for larger crystals (Fig. 16). By Bragg’s law, scattering angles within diffraction patterns also increase. These factors cause complications, but ones that can be addressed by appropriate instrumentation and experimental design (Liu et al., 2013). Notably, the use of small crystals becomes imperative below 4 keV. An additional complication at lower energy comes from the contaminating anomalous noise from other organic elements (C, N and O), which is negligible at higher energy but increases at lower energy. Taking as an example the structure of the TehA homolog of anion channel SLAC1 (Chen et al., 2010; PDB: 3M71), for which the ordered protein and water has the composition C1701 N350 O401 S9, we find that the intrinsic signal-to-noise ratio [rms(f″S) / rms(f″C,N,O)] drops from 1.98 at 7 keV to 1.49 at 3 keV. Such CNO noise should not become a problem, however, unless the sulfur/phosphorous content is low.
Figure 16. Dependence of transmitted anomalous signals on x-ray energy.

To understand the effects of x-ray absorption on the anomalous signal to be expected from sulfur (f″ in electrons) in crystals of varying size, the x-ray transmission through various thicknesses of water was calculated as a function of x-ray energy. Water is used as having x-ray absorptivity similar to that of a protein crystal. Transmitted signals are plotted for various thicknesses; symbols identify the Se K-edge energy and selected relevant low energy values. Reproduced from Fig. 2 of Liu et al. (2013).
As discussed in Section 5.4 above, there are many existing computational options for analyzing MAD and SAD data. We can also expect continuing developments of direct and indirect relevance, notably from the PHENIX and CCP4 consortia. Surely there is room for improvements, for example in phase evaluation from very large anomalous signals and in the treatment of probability. The more open questions, however, concern procedures for the optimal assembly of complete data sets from the partial observations recorded from many crystals or multiple regions within crystals. One active area of study in this regard concerns the problem of crystal clustering and outlier identification, with new contributions appearing shortly after we reported our first results (Liu et al., 2011; Liu et al., 2012; Giordano et al., 2012; Foadi et al, 2013) and programs to treat the single-shot data from serial femtosecond crystallography (White et al., 2013). Another area of importance relates to the control and adjustment for systematic errors, for example by preserving the identity of inverse-beam pairings for local scaling (Matthews and Czerwinski, 1975; Hendrickson & Teeter, 1981) prior to globally collective scaling. Perhaps most importantly, there is an opportunity to improve resolution and data quality through improved monitoring and selection based on understanding of mechanisms of radiation damage (Hendrickson, 1976; Warkentin & Thorne, 2010).
On the instrumentation side, exciting developments are in store from new x-ray sources as well as at beamlines discussed above in Section 5.3. Most recently, entirely new approaches to biological structure analysis are emerging from serial femtosecond crystallography (Chapman et al., 2011) at x-ray free electron lasers (FELs). This was first put into practice at Stanford’s Linac Coherent Light Source (LCLS) and other sources are being developed worldwide. Radiation damage can be eliminated by using single-shot, diffraction-before-destruction procedures with nanocrystals, but challenges are faced in achieving the kind of accuracy required to measure anomalous diffraction signals. Nevertheless, results are beginning to emerge from tests from lysozyme showing that SAD phasing of FEL data should become feasible (Barends et al., 2013a; Barends et al., 2013b). In addition, MAD-like methods are being tested based on FEL-induced stripping of electrons from heavy atoms (Son et al., 2011). New synchrotron sources are also under development. Most imminent are the National Synchrotron Light Source – II (NSLS-II) at Brookhaven, which is diffraction limited in the vertical, and MAX IV in Lund, which employs a novel multibend-achromat accelerator lattice to produce diffraction-limited emission horizontally as well as vertically. Upgrade implementations of such ultimate-storage-ring lattices are in planning for several existing machines.
The new synchrotron sources can readily produce very bright, low-divergence, micron-sized x-ray beams to match emerging needs generally. These qualities are especially important for the challenges of anomalous diffraction. For the optimization of MAD or SAD at resonance (Fig. 1b), having high energy resolution is critical. As shown in Figure 17, poor energy resolution can spoil intrinsically sharp white-line features, such as at the K-edge resonance of selenomethionyl proteins. Signal strength is then reduced accordingly. We are developing microdiffraction beamline NYX at NSLS-II with a novel monochromator design that preserves intrinsic resonant signals. For the optimization of native SAD analyses, low-energy experiments are needed (see Section 6.4); here, when at the preferred lower reaches of energy, microcrystals and thereby microbeams are essential for optimization (Fig. 16). A new long-wavelength (low-energy) beamline (I23) is being built at Diamond, and a low-energy anomalous x-ray diffraction beamline (LAX) is approved for building at NSLS-II. For synchrotron beamlines as for FEL instruments, the appropriate delivery of small crystals into microbeams is a critical focus of instrument development. Detectors are another.
Figure 17. Dependence of apparent resonance strength on energy resolution.

(Left) Anomalous scattering spectra measured from an E. coli selenomethionyl thioredoxin crystal at SSRL beamline 1–5, without any focusing elements (Hendrickson et al., 1990). (Center) Spectra measured from CHO-produced selenomethionyl human chorionic gonadotropin at NSLS beamline X4A, with focusing (Wu et al., 1994). (Right) Spectra measured from selenobiotinyl streptavidin at horizontally focused PF beamline 14A, and analyzed subsequently relative to a comparable sample measured as above at SSRL 1–5 (Fanchon & Hendrickson, 1990). In each case, x-ray absorption spectra were measured from the selenoproteins by fluorescence, and then transformed into theoretical anomalous scattering for atomic selenium to yield experimental edge data on an absolute scale. The monochromator was of Si111 in all cases, and exactly the same analytical procedures and program were used in all cases (Hendrickson et al., 1988). Signal reductions are due to compromised energy resolution from beam divergences.
Supplementary Material
Acknowledgments
I thank the many associates whose work over the past decades has contributed to our developments of MAD and SAD phase evaluation; most notably, I thank Janet Smith (our initial MAD phasing tests on lamprey hemoglobin), Arno Pähler (our first MAD application to an unknown, streptavidin), Craig Ogata (X4A synchrotron beamline), and Qun Liu (native SAD analyses). I also thank Arno Pähler for developing the PDB parser for analyzing the progress of de novo structure determinations, Jie Qin for help with figures, and Maggie Gabanyi and Helen Berman for PDB statistics on PSI structures. Finally, I am grateful to Qun Liu for his critical review and helpful comments. This work was supported in part by NIH grants GM034102 and GM095315, by NSF instrumentation grant DBI-0960034 (NYX beamline), and by the Howard Hughes Medical Institute.
References
- Abrahams JP, Leslie AGW. Methods used in the structure determination of bovine mitochondrial F1 ATPase. Acta Crystallographica D. 1996;52:30–42. doi: 10.1107/S0907444995008754. [DOI] [PubMed] [Google Scholar]
- Akey DL, Brown WC, Dutta S, Konwerski J, Jose J, Jurkiw TJ, DelProposto J, Ogata CM, Skiniotis G, Kuhn RJ, Smith JL. Flavivirus NS1 crystal structures reveal a surface for membrane association and regions of interaction with the immune system. Science. 2014 doi: 10.1126/science.1247749. In press. [DOI] [PMC free article] [PubMed] [Google Scholar]
- Als-Nielsen J, McMorrow D. Elements of Modern X-ray Physics. 2. Chichester: Wiley; 2011. [Google Scholar]
- Amemiya Y, Matsushita T, Nakagawa A, Satow Y, Miyahara M, Chikawa JI. Design and performance of an imaging plate system for X-ray diffraction study. Nuclear Instruments and Methods A. 1988;266:645–653. [Google Scholar]
- Ardiccioni C, Clarke O, Tomasek D, Banerjee S, Rajashankar KR, Liu Q, Guan Z, Li Z, Kloss B, Bruni R, Kloppmann E, Rost B, Shapiro L, Mancia F. Structure and mechanism of GtrB, a polyisoprenyl-phosphate glycosyltransferase. doi: 10.1038/ncomms10175. Submitted. [DOI] [PMC free article] [PubMed] [Google Scholar]
- Assur Z, Mancia F, Cys Z. In preparation. [Google Scholar]
- Ataide SF, Schmitz N, Shen K, Ke A, Shan SO, Doudna JA, Ban N. The crystal structure of the signal recognition particle in complex with its receptor. Science. 2011;331:881–886. doi: 10.1126/science.1196473. [DOI] [PMC free article] [PubMed] [Google Scholar]
- Bae JH, Alefelder S, Kaiser JT, Friedrich R, Moroder L, Huber R, Budisa N. Incorporation of β-selenolo[3,2-b]pyrrolyl-alanine into proteins for phase determination in protein X-ray crystallography. J Mol Biol. 2001;309:925–936. doi: 10.1006/jmbi.2001.4699. [DOI] [PubMed] [Google Scholar]
- Barends TR, Foucar L, Botha S, Doak RB, Shoeman RL, Nass K, Koglin JE, Williams GJ, Boutet S, Messerschmidt M, Schlichting I. De novo protein crystal structure determination from X-ray free-electron laser data. Nature. 2013 Nov 24; doi: 10.1038/nature12773. Epub ahead of print. [DOI] [PubMed] [Google Scholar]
- Barends TR, Foucar L, Shoeman RL, Bari S, Epp SW, Hartmann R, Hauser G, Huth M, Kieser C, Lomb L, Motomura K, Nagaya K, Schmidt C, Strecker R, Anielski D, Boll R, Erk B, Fukuzawa H, Hartmann E, Hatsui T, Holl P, Inubushi Y, Ishikawa T, Kassemeyer S, Kaiser C, Koeck F, Kunishima N, Kurka M, Rolles D, Rudek B, Rudenko A, Sato T, Schroeter CD, Soltau H, Strueder L, Tanaka T, Togashi T, Tono K, Ullrich J, Yase S, Wada SI, Yao M, Yabashi M, Ueda K, Schlichting I. Anomalous signal from S atoms in protein crystallographic data from an X-ray free-electron laser. Acta Crystallogr D. 2013;69:838–842. doi: 10.1107/S0907444913002448. [DOI] [PubMed] [Google Scholar]
- Bass RB, Strop P, Barclay M, Rees DC. Crystal structure of Escherichia coli MscS, a voltage-modulated and mechanosensitive channel. Science. 2002;298:1582–1587. doi: 10.1126/science.1077945. [DOI] [PubMed] [Google Scholar]
- van den Bedem H, Wolf G, Xu Q, Deacon AM. Distributed structure determination at the JCSG. Acta Crystallogr D. 2011;67:368–375. doi: 10.1107/S0907444910039934. [DOI] [PMC free article] [PubMed] [Google Scholar]
- Bes MT, Parisini E, Inda LA, Saraiva LM, Peleato ML, Sheldrick GM. Crystal structure determination at 1.4 A resolution of ferredoxin from the green alga Chlorella fusca. Structure. 1999;7:1201–1211. doi: 10.1016/s0969-2126(00)80054-4. [DOI] [PubMed] [Google Scholar]
- Biertümpfel C, Zhao Y, Kondo Y, Ramón-Maiques S, Gregory M, Lee JY, Masutani C, Lehmann AR, Hanaoka F, Yang W. Structure and mechanism of human DNA polymerase η. Nature. 2010;465:1044–1048. doi: 10.1038/nature09196. [DOI] [PMC free article] [PubMed] [Google Scholar]
- Bijvoet JM. Phase Determination in Direct Fourier-synthesis of Crystal Structures. Proc Acad Sci Amst B. 1949;52:313–314. [Google Scholar]
- Bijvoet JM. Structure of Optically Active Compounds in the Solid State. Nature. 1954;173:888–891. [Google Scholar]
- Bijvoet JM, Bokhoven C, Schoone JC. On the crystal structure of strychnine sulfate and selenate. II. [010] projection and structure formula. Koninklijke Nederlandse Akademie van Wetenschappen Proceedings. 1948;51:990–990. [Google Scholar]
- Bijvoet JM, Bokhoven C, Schoone JC. On the crystal structure of strychnine sulfate and selenate. III. [001] projection. Koninklijke Nederlandse Akademie van Wetenschappen Proceedings. 1949;52:120–121. [Google Scholar]
- Bijvoet JM, Peerdeman AF, van Bommel AJ. Determination of the Absolute Configuration of Optically Active Compounds by Means of X-Rays. Nature. 1951;168:271–272. [Google Scholar]
- Biou V, Shu F, Ramakrishnan V. X-ray crystallography shows that translational initiation factor IF3 consists of two compact α/β domains linked by an α-helix. EMBO J. 1995;14:4056–4064. doi: 10.1002/j.1460-2075.1995.tb00077.x. [DOI] [PMC free article] [PubMed] [Google Scholar]
- Blow DM. The Structure of Haemoglobin. VII. Determination of Phase Angles in the Non-Centrosymmetric [100] Zone. Proc Roy Soc A. 1958;247:302–336. [Google Scholar]
- Blow DM. How Bijvoet made the difference: the growing power of anomalous scattering. Methods Enzymol. 2003;374:3–22. doi: 10.1016/S0076-6879(03)74001-4. [DOI] [PubMed] [Google Scholar]
- Blow DM, Crick FHC. The treatment of errors in the isomorphous replacement method. Acta Crystallogr. 1959;12:794–802. [Google Scholar]
- Blow DM, Rossmann MG. The Single Isomorphous Replacement Method. Acta Cryst. 1961;14:1195–1202. [Google Scholar]
- Blundell TL, Johnson LN. Protein Crystallography. London: Academic Press; 1976. [Google Scholar]
- Bokhoven C, Schoone JC, Bijvoet JM. The Fourier synthesis of the crystal structure of strychnine sulphate pentahydrate. Acta Crystallographica. 1951;4:275–280. [Google Scholar]
- Boles JO, Henderson J, Hatch D, Silks LA. Synthesis and incorporation of [6,7]-selenatryptophan into dihydrofolate reductase. Biochem Biophys Res Commun. 2002;298:257–261. doi: 10.1016/s0006-291x(02)02438-5. [DOI] [PubMed] [Google Scholar]
- Bonanno JB, Almo SC, Bresnick A, Chance MR, Fiser A, Swaminathan S, Jiang J, Studier FW, Shapiro L, Lima CD, Gaasterland TM, Sali A, Bain K, Feil I, Gao X, Lorimer D, Ramos A, Sauder JM, Wasserman SR, Emtage S, D’Amico KL, Burley SK. New York-Structural GenomiX Research Consortium (NYSGXRC): a large scale center for the protein structure initiative. J Struct Funct Genomics. 2005;6:225–232. doi: 10.1007/s10969-005-6827-0. [DOI] [PubMed] [Google Scholar]
- Bragg WH, Bragg WL. The structure of the diamond. Proceedings of the Royal Society London. 1913;A89:277–291. [Google Scholar]
- Bragg WL. The diffraction of short electromagnetic waves by a crystal. Proc Camb Phil Soc. 1913a;17:43–57. [Google Scholar]
- Bragg WL. The structure of some crystals as indicated by their diffraction of x-rays. Proceedings of the Royal Society London. 1913b;A89:248–277. [Google Scholar]
- Bragg WL. The analysis of crystals by the x-ray spectrometer. Proceedings of the Royal Society London. 1914;A89:468–489. [Google Scholar]
- Bragg WL. The determination of parameters in crystal structures by means of Fourier series. Proc Roy Soc A. 1929;123:537–559. [Google Scholar]
- Brasch J, Harrison OJ, GAhlsen G, Liu G, Shapiro L. Crystal structure of the ligand binding domain of netrin G2. J Mol Biol. 2011;414:723–734. doi: 10.1016/j.jmb.2011.10.030. [DOI] [PMC free article] [PubMed] [Google Scholar]
- Brodersen DE, de La Fortelle E, Vonrhein C, Bricogne G, Nyborg J, Kjeldgaard M. Applications of single-wavelength anomalous dispersion at high and atomic resolution. Acta Cryst D. 2000;56:431–441. doi: 10.1107/s0907444900000834. [DOI] [PubMed] [Google Scholar]
- Burling FT, Weis WI, Flaherty KM, Brunger AT. Direct observation of protein solvation and discrete disorder with experimental crystallographic phases. Science. 1996;271:72–77. doi: 10.1126/science.271.5245.72. [DOI] [PubMed] [Google Scholar]
- Cate JH, Gooding AR, Podell E, Zhou K, Golden BL, Kundrot CE, Cech TR, Doudna JA. Crystal structure of a group I ribozyme domain: principles of RNA packing. Science. 1996;273:1678–1685. doi: 10.1126/science.273.5282.1678. [DOI] [PubMed] [Google Scholar]
- Cate JH, Yusupov MM, Yusupova GZ, Earnest TN, Noller HF. X-ray crystal structures of 70S ribosome functional complexes. Science. 1999;285:2095–2104. doi: 10.1126/science.285.5436.2095. [DOI] [PubMed] [Google Scholar]
- Chandra V, Huang P, Hamuro Y, Raghuram S, Wang Y, Burris TP, Rastinejad F. Structure of the intact PPAR-gamma-RXR- nuclear receptor complex on DNA. Nature. 2008;456:350–356. doi: 10.1038/nature07413. [DOI] [PMC free article] [PubMed] [Google Scholar]
- Chang Y, Bruni R, Kloss B, Assur Z, Kloppmann E, Rost B, Hendrickson WA, Liu Q. Structural basis for biochemical action by anti-apoptotic membrane proteins. Submitted. [Google Scholar]
- Chapman HN, Fromme P, Barty A, White TA, Kirian RA, Aquila A, Hunter MS, Schulz J, DePonte DP, Weierstall U, Doak RB, Maia FR, Martin AV, Schlichting I, Lomb L, Coppola N, Shoeman RL, Epp SW, Hartmann R, Rolles D, Rudenko A, Foucar L, Kimmel N, Weidenspointner G, Holl P, Liang M, Barthelmess M, Caleman C, Boutet S, Bogan MJ, Krzywinski J, Bostedt C, Bajt S, Gumprecht L, Rudek B, Erk B, Schmidt C, Hömke A, Reich C, Pietschner D, Strüder L, Hauser G, Gorke H, Ullrich J, Herrmann S, Schaller G, Schopper F, Soltau H, Kühnel KU, Messerschmidt M, Bozek JD, Hau-Riege SP, Frank M, Hampton CY, Sierra RG, Starodub D, Williams GJ, Hajdu J, Timneanu N, Seibert MM, Andreasson J, Rocker A, Jönsson O, Svenda M, Stern S, Nass K, Andritschke R, Schröter CD, Krasniqi F, Bott M, Schmidt KE, Wang X, Grotjohann I, Holton JM, Barends TR, Neutze R, Marchesini S, Fromme R, Schorb S, Rupp D, Adolph M, Gorkhover T, Andersson I, Hirsemann H, Potdevin G, Graafsma H, Nilsson B, Spence JC. Femtosecond X-ray protein nanocrystallography. Nature. 2011;470:73–77. doi: 10.1038/nature09750. [DOI] [PMC free article] [PubMed] [Google Scholar]
- Chen L, Glover JN, Hogan PG, Rao A, Harrison SC. Structure of the DNA-binding domains from NFAT, Fos and Jun bound specifically to DNA. Nature. 1998;392:42–48. doi: 10.1038/32100. [DOI] [PubMed] [Google Scholar]
- Chen YH, Hu L, Punta M, Bruni R, Hillerich B, Kloss B, Rost B, Love J, Siegelbaum SA, Hendrickson WA. Homologue structure of the SLAC1 anion channel for closing stomata in leaves. Nature. 2010;467:1074–1080. doi: 10.1038/nature09487. [DOI] [PMC free article] [PubMed] [Google Scholar]
- Chen L, Rose JP, Breslow E, Yang D, Chang WR, Furey WF, Jr, Sax M, Wang BC. Crystal structure of a bovine neurophysin II dipeptide complex at 2.8 Å determined from the single-wavelength anomalous scattering signal of an incorporated iodine atom. Proc Natl Acad Sci USA. 1991;88:4240–4244. doi: 10.1073/pnas.88.10.4240. [DOI] [PMC free article] [PubMed] [Google Scholar]
- Chen Z, Yang H, Pavletich NP. Mechanism of homologous recombination from the RecA-ssDNA/dsDNA structures. Nature. 2008;453:489–494. doi: 10.1038/nature06971. [DOI] [PubMed] [Google Scholar]
- Cho HS, Leahy DJ. Structure of the extracellular region of HER3 reveals an interdomain tether. Science. 2002;297:1330–1333. doi: 10.1126/science.1074611. [DOI] [PubMed] [Google Scholar]
- Conner BN, Takano T, Tanaka S, Itakura K, Dickerson RE. The molecular structure of d(ICpCpGpG), a fragment of right-handed double helical A-DNA. Nature. 1982;295:294–299. doi: 10.1038/295294a0. [DOI] [PubMed] [Google Scholar]
- Coster D, Knol KS, Prins JA. Unterschiede in der Intensität der Röntgenstrahlenreflexion an den beiden 111-Flächen der Zinkblende. Zeitschrift für Physik. 1930;63:345–369. [Google Scholar]
- Cowtan K. Joint CCP4 and ESF-EACBM Newsletter on Protein Crystallography no 31SERC. Daresbury Laboratory; Warrington, UK: 1994. DM, an automated procedure for phase improvement by density modification; pp. 34–48. [Google Scholar]
- Cowtan K. The Buccaneer software for automated model building. 1. Tracing protein chains. Acta Crystallogr D. 2006;62:1002–1011. doi: 10.1107/S0907444906022116. [DOI] [PubMed] [Google Scholar]
- Cowtan K. Recent developments in classical density modification. Acta Crystallogr D. 2010;66:470–478. doi: 10.1107/S090744490903947X. [DOI] [PMC free article] [PubMed] [Google Scholar]
- Cowtan KD, Main P. Improvement of macromolecular electron-density maps by the simultaneous application of real and reciprocal space constraints. Acta Crystallogr D. 1993;49:148–157. doi: 10.1107/S0907444992007698. DM. [DOI] [PubMed] [Google Scholar]
- Cowtan KD, Zhang KYJ. Density modification for macromolecular phase improvement. Prog Biophys Mol Biol. 1999;72:245–270. doi: 10.1016/s0079-6107(99)00008-5. [DOI] [PubMed] [Google Scholar]
- Cramer P, Bushnell DA, Kornberg RD. Structural basis of transcription: RNA polymerase II at 2.8 Ångstrom resolution. Science. 2001;292:1863–1876. doi: 10.1126/science.1059493. [DOI] [PubMed] [Google Scholar]
- Cramer SP, Hodgson KO. X-Ray Absorption Spectroscopy: A New Structural Method and Its Applications to Bioinorganic Chemistry. Prog Inorg Chem. 1979;25:1–39. [Google Scholar]
- Cromer DT, Liberman D. Relativistic Calculation of Anomalous Scattering Factors for X-rays. J Chem Phys. 1970;53:1891–1898. [Google Scholar]
- Dahms SO, Kuester M, Streb C, Roth C, Sträter N, Than ME. Localization and orientation of heavy-atom cluster compounds in protein crystals using molecular replacement. Acta Crystallogr D. 2013;69:284–297. doi: 10.1107/S0907444912046008. [DOI] [PMC free article] [PubMed] [Google Scholar]
- Dauter Z, Adamiak DA. Anomalous signal of phosphorus used for phasing DNA oligomer: importance of data redundancy. Acta Crystallogr D. 2001;57:990–995. doi: 10.1107/s0907444901006382. [DOI] [PubMed] [Google Scholar]
- Dauter Z, Dauter M. Anomalous signal of solvent bromides used for phasing of lysozyme. J Mol Biol. 1999;289:93–101. doi: 10.1006/jmbi.1999.2744. [DOI] [PubMed] [Google Scholar]
- Dauter Z, Dauter M. Entering a new phase: using solvent halide ions in protein structure determination. Structure. 2001;9:R21–26. doi: 10.1016/s0969-2126(01)00565-2. [DOI] [PubMed] [Google Scholar]
- Dauter Z, Dauter M, Dodson E. Jolly SAD. Acta Crystallogr D. 2002;58:494–506. doi: 10.1107/s090744490200118x. [DOI] [PubMed] [Google Scholar]
- Dauter Z, Dauter M, de La Fortelle E, Bricogne G, Sheldrick GM. Can anomalous signal of sulfur become a tool for solving protein crystal structures? J Mol Biol. 1999;289:83–92. doi: 10.1006/jmbi.1999.2743. [DOI] [PubMed] [Google Scholar]
- Deacon AM, Ealick SE. Selenium-based MAD phasing: setting the sites on larger structures. Structure. 1999;15:R161–166. doi: 10.1016/s0969-2126(99)80096-3. [DOI] [PubMed] [Google Scholar]
- DeLaBarre B, Brünger AT. Complete Structure of p97/valosin-containing Protein Reveals Communication between Nucleotide Domains. Nat Struct Biol. 2003;10:856–863. doi: 10.1038/nsb972. [DOI] [PubMed] [Google Scholar]
- Doublié S. Production of selenomethionyl proteins in prokaryotic and eukaryotic expression systems. Methods Mol Biol. 2007;363:91–108. doi: 10.1007/978-1-59745-209-0_5. [DOI] [PubMed] [Google Scholar]
- Dyda F, Hickman AB, Jenkins TM, Engelman A, Craigie R, Davies DR. Crystal structure of the catalytic domain of HIV-1 integrase: similarity to other polynucleotidyl transferases. Science. 1994;266:1981–1986. doi: 10.1126/science.7801124. [DOI] [PubMed] [Google Scholar]
- Evans G, Bricogne G. Triiodide derivatization in protein crystallography. Acta Crystallogr D. 2003;59:1923–1929. doi: 10.1107/s0907444903012897. [DOI] [PubMed] [Google Scholar]
- Evans G, Pettifer R. CHOOCH: a program for deriving anomalous-scattering factors from X-ray fluorescence spectra. J Appl Crystallogr. 2001;34:82–86. [Google Scholar]
- Evans PR. An introduction to data reduction: space-group determination, scaling and intensity statistics. Acta Crystallogr D. 2011;67:282–292. doi: 10.1107/S090744491003982X. [DOI] [PMC free article] [PubMed] [Google Scholar]
- Ewald PP, Hermann C. Gilt der Friedelsche Satz über die Symmetrie der Röntgensinterferenzen? Zeitschrift für Kristallographie. 1927;65:251–260. [Google Scholar]
- Fan H-F, Gu Y-X. Combining direct methods with isomorphous replacement or anomalous scattering data. III. The incorporation of partial structure information. Acta Cryst. 1985;A41:280–284. [Google Scholar]
- Fanchon E, Hendrickson WA. Effect of Anisotropy in Anomalous Scattering on the MAD Phasing Method. Acta Crystallogr A. 1990;46:809–820. doi: 10.1107/s0108767390005967. [DOI] [PubMed] [Google Scholar]
- Feng L, Campbell EB, Hsiung Y, MacKinnon R. Structure of a eukaryotic CLC transporter defines an intermediate state in the transport cycle. Science. 2010;330:635–641. doi: 10.1126/science.1195230. [DOI] [PMC free article] [PubMed] [Google Scholar]
- Foadi J, Aller P, Alguel Y, Cameron A, Axford D, Owen RL, Armour W, Waterman DG, Iwata S, Evans G. Clustering procedures for the optimal selection of data sets from multiple crystals in macromolecular crystallography. Acta Crystallogr D. 2013;69:1617–1632. doi: 10.1107/S0907444913012274. [DOI] [PMC free article] [PubMed] [Google Scholar]
- de la Fortelle E, Bricogne G. Maximum-likelihood Heavy-atom Parameter Refinement for Multiple Isomorphous Replacement and Multiwavelength Anomalous Diffraction Methods. Methods Enzymol. 1997;276:472–494. doi: 10.1016/S0076-6879(97)76073-7. [DOI] [PubMed] [Google Scholar]
- Fourme R, Hendrickson WA. Analysis of Macromolecular Structures by the Method of Multiwavelength Anomalous Diffraction. In: Hasnain SS, editor. Synchrotron Radiation and Biophysics. Chichester: Ellis Horwood Limited; 1990. pp. 156–175. [Google Scholar]
- Friedrich W, Knipping P, Laue M. Interferenz-Erscheinungen bei Röntgenstrahlen. Sitz Bayer Akad Wiss. 1912:303–322. [Google Scholar]
- Furey W, Swaminathan S. PHASES-95: A Program Package for Processing and Analyzing Diffraction Data from Macromolecules. Methods Enzymol. 1997;276:590–620. doi: 10.1016/s0076-6879(97)77033-2. [DOI] [PubMed] [Google Scholar]
- Geiger JH, Hahn S, Lee S, Sigler PB. Crystal structure of the yeast TFIIA/TBP/DNA complex. Science. 1996;272:830–836. doi: 10.1126/science.272.5263.830. [DOI] [PubMed] [Google Scholar]
- Giordano R, Leal RM, Bourenkov GP, McSweeney S, Popov AN. The application of hierarchical cluster analysis to the selection of isomorphous crystals. Acta Crystallogr D. 2012;68:649–658. doi: 10.1107/S0907444912006841. [DOI] [PubMed] [Google Scholar]
- Girard E, Stelter M, Vicat J, Kahn R. A new class of lanthanide complexes to obtain high-phasing-power heavy-atom derivatives for macromolecular crystallography. Acta Crystallogr D. 2003;59:1914–1922. doi: 10.1107/s0907444903020511. [DOI] [PubMed] [Google Scholar]
- Graves BJ, Hatada MH, Hendrickson WA, Miller JK, Madison VS, Satow Y. Structure of Interleukin-1α at 2.7 Å Resolution. Biochemistry. 1990;29:2679–2684. doi: 10.1021/bi00463a009. [DOI] [PubMed] [Google Scholar]
- Green DW, Ingram VM, Perutz MF. The Structure of Haemoglobin IV. Sign Determination by the Isomorphous Replacement Method. Proc Roy Soc A. 1954;225:287–307. [Google Scholar]
- Guss JM, Merritt EA, Phizackerley RP, Hedman B, Murata M, Hodgson KO, Freeman HC. Phase determination by multiple-wavelength x-ray diffraction: crystal structure of a basic “blue” copper protein from cucumbers. Science. 1988;241:806–811. doi: 10.1126/science.3406739. [DOI] [PubMed] [Google Scholar]
- Harada S, Yasui M, Murakawa K, Kasai N, Satow Y. Crystal structure analysis of cytochrome c′ by the multiwavelength anomalous diffraction method using synchrotron radiation. J Appl Crystallogr. 1986;19:448–452. [Google Scholar]
- Harris SF, Botchan MR. Crystal structure of the human papillomavirus type 18 E2 activation domain. Science. 1999;284:673–677. doi: 10.1126/science.284.5420.1673. [DOI] [PubMed] [Google Scholar]
- Harvey I, Hao Q, Duke EM, Ingledew J, Hasnain SS. Structure determination of a 16.8 kDa copper protein at 2.1 A resolution using anomalous scattering data with direct methods. Acta Cryst D. 1998;54:629–635. doi: 10.1107/s0907444998005423. [DOI] [PubMed] [Google Scholar]
- Hauptman HA. Shake-and-bake: An algorithm for automatic solution ab initio of crystal structures. Methods Enzymol. 1997;277:3–13. doi: 10.1016/s0076-6879(97)77003-4. [DOI] [PubMed] [Google Scholar]
- Hauptman H, Karle J. ACA Monograph No 3. Polycrystal Book Service; 1953. Solution of the Phase Problem I. The Centrosymmetric Crystal. [Google Scholar]
- Hendrickson WA. Some Aids for Breaking the Phase Ambiguity in the Single Isomorphous Replacement Methods. Acta Crystallogr B. 1971;27:1474–1475. [Google Scholar]
- Hendrickson WA. Radiation damage in protein crystallography. J Mol Biol. 1976;106:889–893. doi: 10.1016/0022-2836(76)90271-0. [DOI] [PubMed] [Google Scholar]
- Hendrickson WA. Phase information from anomalous-scattering measurements. Acta Crystallogr A. 1979;35:245–247. [Google Scholar]
- Hendrickson WA. Measurement and use of anomalous x-ray scattering. Acta Crystallogr A. 1984;40:C3. [Google Scholar]
- Hendrickson WA. Analysis of Protein Structure from Diffraction Measurements at Multiple Wavelengths. Trans Amer Cryst Assn. 1985;21:11–21. [Google Scholar]
- Hendrickson WA. Determination of Macromolecular Structures from Anomalous Diffraction of Synchrotron Radiation. Science. 1991;254:51–58. doi: 10.1126/science.1925561. [DOI] [PubMed] [Google Scholar]
- Hendrickson WA. Maturation of MAD Phasing for the Determination of Macromolecular Structures. J Synchrotron Rad. 1999;6:845–851. [Google Scholar]
- Hendrickson WA. Synchrotron Crystallography. Trends Biochem Sci. 2000;12:637–643. doi: 10.1016/s0968-0004(00)01721-7. [DOI] [PubMed] [Google Scholar]
- Hendrickson WA. Evolution of Diffraction Methods for Solving Crystal Structures. Acta Crystallogr A. 2013;69:51–59. doi: 10.1107/S0108767312050453. [DOI] [PubMed] [Google Scholar]
- Hendrickson WA, Co MS, Smith JL, Hodgson KO, Klippenstein GL. X-ray Absorption Spectroscopy of the Dimeric Iron Site in Azidomethemerythrin from Phascolopsis gouldii. Proc Natl Acad Sci USA. 1982;79:6255–6259. doi: 10.1073/pnas.79.20.6255. [DOI] [PMC free article] [PubMed] [Google Scholar]
- Hendrickson WA, Horton JR, LeMaster DM. Selenomethionyl Proteins Produced for Analysis by Multiwavelength Anomalous Diffraction (MAD): A Vehicle for Direct Determination of Three-Dimensional Structure. EMBO J. 1990;9:1665–1672. doi: 10.1002/j.1460-2075.1990.tb08287.x. [DOI] [PMC free article] [PubMed] [Google Scholar]
- Hendrickson WA, Klippenstein GL, Ward KB. Tertiary Structure of Myohemerythrin at Low Resolution. Proc Natl Acad Sci USA. 1975;72:2160–2164. doi: 10.1073/pnas.72.6.2160. [DOI] [PMC free article] [PubMed] [Google Scholar]
- Hendrickson WA, Ogata CM. Phase Determination from Multiwavelength Anomalous Diffraction Measurements. Methods Enzymol. 1997;276:494–523. doi: 10.1016/S0076-6879(97)76074-9. [DOI] [PubMed] [Google Scholar]
- Hendrickson WA, Pähler A, Smith JL, Satow Y, Merritt EA, Phizackerley RP. Crystal Structure of Core Streptavidin Determined from Multiwavelength Anomalous Diffraction of Synchrotron Radiation. Proc Natl Acad Sci USA. 1989;86:2190–2194. doi: 10.1073/pnas.86.7.2190. [DOI] [PMC free article] [PubMed] [Google Scholar]
- Hendrickson WA, Sheriff S. General Density Function Corresponding to X-ray Diffraction with Anomalous Scattering Included. Acta Crystallogr A. 1987;43:121–125. [Google Scholar]
- Hendrickson WA, Smith JL, Phizackerley RP, Merritt EA. Crystallographic Structure Analysis of Lamprey Hemoglobin from Anomalous Dispersion of Synchrotron Radiation. Proteins. 1988;4:77–88. doi: 10.1002/prot.340040202. [DOI] [PubMed] [Google Scholar]
- Hendrickson WA, Teeter MM. Structure of the Hydrophobic Protein Crambin Determined Directly from the Anomalous Scattering of Sulfur. Nature. 1981;290:107–113. doi: 10.1038/290107a0. [DOI] [PMC free article] [PubMed] [Google Scholar]
- Hendrickson WA, Wüthrich K, editors. Macromolecular Structures 1991. London: Current Biology; 1991. [Google Scholar]
- Hendrickson WA, Wüthrich K, editors. Macromolecular Structures 2000. London: Current Biology; 2000. [Google Scholar]
- Herriott JR, Sieker LC, Jensen LH, Lovenberg W. Structure of Rubredoxin: An X-ray Study to 2.5Å Resolution. J Mol Biol. 1970;50:391–406. doi: 10.1016/0022-2836(70)90200-7. [DOI] [PubMed] [Google Scholar]
- Herzenberg A, Lau HSM. Anomalous scattering and the phase problem. Acta Cryst. 1967;22:24–28. [Google Scholar]
- Hönl H. Zur Dispersionstheorie der Röntgenstrahlen. Zeitschrift für Physik. 1933;84:1–16. [Google Scholar]
- Hope H, de la Camp U. Anomalous scattering by oxygen: measurements on (+)-tartaric acid. Acta Cryst A. 1972;28:201–207. [Google Scholar]
- Hoppe W, Jakubowski V. The Determination of Phases of Erythrocruorin Using the Two-Wavelength Method with Iron as Anomalous Scatterer. In: Ramaseshan S, Abrahams S, editors. Anomalous Scattering. Copenhagen: Munksgård; 1971. pp. 437–461. [Google Scholar]
- Hubbard SR, Wei L, Ellis L, Hendrickson WA. Crystal structure of the tyrosine kinase domain of the human insulin receptor. Nature. 1994;372:746–754. doi: 10.1038/372746a0. [DOI] [PubMed] [Google Scholar]
- Istvan ES, Palnitkar M, Buchanan SK, Deisenhofer J. Crystal structure of the catalytic portion of human HMG-CoA reductase: insights into regulation of activity and catalysis. EMBO J. 2000;19:819–830. doi: 10.1093/emboj/19.5.819. [DOI] [PMC free article] [PubMed] [Google Scholar]
- Jadzinsky PD, Calero G, Ackerson CJ, Bushnell DA, Kornberg RD. Structure of a thiol monolayer-protected gold nanoparticle at 1.1 Å resolution. Science. 2007;318:430–433. doi: 10.1126/science.1148624. [DOI] [PubMed] [Google Scholar]
- James RW. The Optical Principles of the Diffraction of X-rays. London: Bell; 1948. [Google Scholar]
- Jeruzalmi D, O’Donnell M, Kuriyan J. Crystal structure of the processivity clamp loader gamma (gamma) complex of E. coli DNA polymerase III. Cell. 2001;106:429–441. doi: 10.1016/s0092-8674(01)00463-9. [DOI] [PubMed] [Google Scholar]
- Jin MS, Oldham ML, Zhang Q, Chen J. Crystal structure of the multidrug transporter P-glycoprotein from Caenorhabditis elegans. Nature. 2012;490:566–569. doi: 10.1038/nature11448. [DOI] [PMC free article] [PubMed] [Google Scholar]
- Kabsch W. XDS. Acta Crystallogr D. 2010;66:125–132. doi: 10.1107/S0907444909047337. [DOI] [PMC free article] [PubMed] [Google Scholar]
- Kahn R, Fourme R, Bosshard R, Chiadmi M, Risler JL, Dideberg O, Wery JP. Crystal Structure Study of Opsanus tau Parvalbumin by Multiwavelength Anomalous Diffraction. FEBS Lett. 1985;179:133–137. doi: 10.1016/0014-5793(85)80207-6. [DOI] [PubMed] [Google Scholar]
- Kallman H, Mark H. Über die Dispersion und Streuung von Röntgenstrahlen. Ann Physik. 1927;82:585–604. [Google Scholar]
- Karle J. Anomalous scatterers in x-ray diffraction and the use of several wavelengths. Appl Optics. 1967;6:2132–2135. doi: 10.1364/AO.6.002132. [DOI] [PubMed] [Google Scholar]
- Karle J. Some Developments in Anomalous Dispersion for the Structure Investigation of Macromolecular Systems in Biology. Int J Quantum Chem Symp. 1980;7:357–367. [Google Scholar]
- Karle J, Hauptman H. The phases and magnitudes of the structure factors. Acta Crystallographica. 1950;3:181–187. [Google Scholar]
- Karle J, Hauptman H. A theory of phase determination for the four types of non-centrosymmetric space groups 1P222, 2P22, 3P12, 3P22. Acta Crystallographica. 1956;9:635–651. [Google Scholar]
- Kawate T, Michel JC, Birdsong WT, Gouaux E. Crystal structure of the ATP-gated P2X4 ion channel in the closed state. Nature. 2009;460:592–598. doi: 10.1038/nature08198. [DOI] [PMC free article] [PubMed] [Google Scholar]
- Kazantsev AV, Krivenko AA, Pace NR. Mapping metal-binding sites in the catalytic domain of bacterial RNase P RNA. RNA. 2009;15:266–276. doi: 10.1261/rna.1331809. [DOI] [PMC free article] [PubMed] [Google Scholar]
- Kendrew JC, Bodo G, Dintzis HM, Parrish RG, Wyckoff H, Phillips DC. A three-dimensional model of the myoglobin molecule obtained by x-ray analysis. Nature. 1958;181:662–666. doi: 10.1038/181662a0. [DOI] [PubMed] [Google Scholar]
- Kim Y, Babnigg G, Jedrzejczak R, Eschenfeldt WH, Li H, Maltseva N, Hatzos-Skintges C, Gu M, Makowska-Grzyska M, Wu R, An H, Chhor G, Joachimiak A. High-throughput protein purification and quality assessment for crystallization. Methods. 2011;55:12–28. doi: 10.1016/j.ymeth.2011.07.010. [DOI] [PMC free article] [PubMed] [Google Scholar]
- Kincaid BM, Eisenberger P, Hodgson KO, Doniach S. X-ray Absorption Spectroscopy Using Synchrotron Radiation for Structural Investigation of Organometallic Molecules of Biological Interest. Proc Natl Acad Sci USA. 1975;72:2340–2342. doi: 10.1073/pnas.72.6.2340. [DOI] [PMC free article] [PubMed] [Google Scholar]
- Kitagawa D, Vakonakis I, Olieric N, Hilbert M, Keller D, Olieric V, Bortfeld M, Erat MC, Flückiger I, Gönczy P, Steinmetz MO. Structural basis of the 9-fold symmetry of centrioles. Cell. 2011;144:364–375. doi: 10.1016/j.cell.2011.01.008. [DOI] [PMC free article] [PubMed] [Google Scholar]
- Kitago Y, Watanabe N, Tanaka I. Structure determination of a novel protein by sulfur SAD using chromium radiation in combination with a new crystal-mounting method. Acta Crystallogr D. 2005;61:1013–1021. doi: 10.1107/S0907444905012734. [DOI] [PubMed] [Google Scholar]
- Knäblein J, Neuefeind T, Schneider F, Bergner A, Messerschmidt A, Löwe J, Steipe B, Huber R. Ta6Br122+, a tool for phase determination of large biological assemblies by X-ray crystallography. J Mol Biol. 1997;270:1–7. doi: 10.1006/jmbi.1997.1074. [DOI] [PubMed] [Google Scholar]
- Kolatkar PR, Ernst SR, Hackert ML, Ogata CM, Hendrickson WA, Merritt EA, Phizackerley RP. The Structure Determination and Refinement of Homotetrameric Hemoglobin from Urechis caupo at 2.5 Å Resolution. Acta Cryst B. 1992;48:191–199. doi: 10.1107/s0108768191012363. [DOI] [PubMed] [Google Scholar]
- Korzun ZR. The tertiary structure of azurin from Pseudomonas denitrificans as determined by Cu resonant diffraction using synchrotron radiation. J Mol Biol. 1987;196:413–419. doi: 10.1016/0022-2836(87)90701-7. [DOI] [PubMed] [Google Scholar]
- Kramers HA, Heisenberg W. Über die Streuung von Strahlung durch Atome. Zeitschrift für Physik. 1925;31:681–708. [Google Scholar]
- de Kronig RL. On the theory of dispersion of x-rays. Journal of the Optical Society of America. 1926;12:547–557. [Google Scholar]
- de Kronig RL, Kramers HA. Zur Theorie der Absorption und Dispersion in den Röntgenspektren. Zeitschrift für Physik. 1928;48:174–179. [Google Scholar]
- Langer G, Cohen SX, Lamzin VS, Perrakis A. Automated macromolecular model building for X-ray crystallography using ARP/wARP version 7. Nat Protoc. 2008;3:1171–1179. doi: 10.1038/nprot.2008.91. [DOI] [PMC free article] [PubMed] [Google Scholar]
- Lattman EE, Nockolds CE, Kretsinger RH, Love WE. Structure of Yellow Fin Tuna Metmyoglobin at 6Å Resolution. J Mol Biol. 1971;60:271–277. doi: 10.1016/0022-2836(71)90293-2. [DOI] [PubMed] [Google Scholar]
- Leahy DJ, Erickson HP, Aukhil I, Joshi P, Hendrickson WA. Crystallization of a Fragment of Human Fibronectin: Introduction of Methionine by Site-Directed Mutagenesis to Allow Phasing via Selenomethionine. Proteins. 1994;19:48–54. doi: 10.1002/prot.340190107. [DOI] [PubMed] [Google Scholar]
- Leahy DJ, Hendrickson WA, Aukhil I, Erickson HP. Structure of a Fibronectin Type III Domain from Tenascin Phased by MAD Analysis of the Selenomethionyl Protein. Science. 1992;258:987–991. doi: 10.1126/science.1279805. [DOI] [PubMed] [Google Scholar]
- Lee C, Goldberg J. Structure of coatomer cage proteins and the relationship among COPI, COPII, and clathrin vesicle coats. Cell. 2010;142:123–132. doi: 10.1016/j.cell.2010.05.030. [DOI] [PMC free article] [PubMed] [Google Scholar]
- Leonard TA, Różycki B, Saidi LF, Hummer G, Hurley JH. Crystal structure and allosteric activation of protein kinase C βII. Cell. 2011;144:55–66. doi: 10.1016/j.cell.2010.12.013. [DOI] [PMC free article] [PubMed] [Google Scholar]
- Lidestri JP, Hendrickson WA. Optimization of X-ray Energy Resolution from a Horizontally Focused Single-crystal Monochromator. Nucl Instr Meth A. 2009;599:289–300. [Google Scholar]
- Liu Q, Liu QQ, Hendrickson WA. Robust structural analysis of native biological macromolecules from multi-crystal anomalous diffraction data. Acta Crystallor D. 2013;69:1314–1332. doi: 10.1107/S0907444913001479. [DOI] [PMC free article] [PubMed] [Google Scholar]
- Liu Q, Dahmane T, Zhang Z, Assur Z, Brasch J, Shapiro L, Mancia F, Hendrickson WA. Structures from Anomalous Diffraction Data of Native Biological Macromolecules. Science. 2012;336:1033–1037. doi: 10.1126/science.1218753. [DOI] [PMC free article] [PubMed] [Google Scholar]
- Liu Q, Zhang Z, Hendrickson WA. Multi-crystal Anomalous Diffraction for Low Resolution Macromolecular Phasing. Acta Cryst D. 2011;67:45–59. doi: 10.1107/S0907444910046573. [DOI] [PMC free article] [PubMed] [Google Scholar]
- Liu Y, Ogata CM, Hendrickson WA. Multiwavelength Anomalous Diffraction Analysis at the M Absorption Edges of Uranium. Proc Natl Acad Sci USA. 2001;98:10648–10653. doi: 10.1073/pnas.191003998. [DOI] [PMC free article] [PubMed] [Google Scholar]
- Liu Z-J, Vysotski ES, Chen C-J, Rose JP, Lee J, Wang B-C. Structure of the Ca2+-regulated photoprotein obelin at 1.7 A resolution determined directly from its sulfur substructure. Protein Sci. 2000;9:2085–2093. doi: 10.1110/ps.9.11.2085. [DOI] [PMC free article] [PubMed] [Google Scholar]
- Lye RC, Phillips JC, Kaplan D, Doniach S, Hodgson KO. White Lines in L-edge X-ray Absorption Spectra and their Implications for Anomalous Diffraction Studies of Biological Materials. Proc Natl Acad Sci USA. 1980;77:5884–5888. doi: 10.1073/pnas.77.10.5884. [DOI] [PMC free article] [PubMed] [Google Scholar]
- Mancusso R, Gregorio GG, Liu Q, Wang DN. Structure and mechanism of a bacterial sodium-dependent dicarboxylate transporter. Nature. 2012;491:622–626. doi: 10.1038/nature11542. [DOI] [PMC free article] [PubMed] [Google Scholar]
- Mark H, Szilard L. Ein einfacher Versuch zu Auffindung eines selektiven Effektes bei der estreuung von Röntgenstrahlen. Zeitschrift für Physik. 1925;33:688–691. [Google Scholar]
- Martin JL, Bardwell JC, Kuriyan J. Crystal structure of the DsbA protein required for disulphide bond formation in vivo. Nature. 1993;365:464–468. doi: 10.1038/365464a0. [DOI] [PubMed] [Google Scholar]
- Martinez-Hackert E, Hendrickson WA. Promiscuous substrate recognition in folding and assembly activities of the trigger factor chaperone. Cell. 2009;138:923–934. doi: 10.1016/j.cell.2009.07.044. [DOI] [PMC free article] [PubMed] [Google Scholar]
- Matthews B, Czerwinski EW. Local scaling: a method to reduce systematic errors in isomorphous replacement and anomalous scattering measurements. Acta Cryst A. 1975;31:480–487. [Google Scholar]
- Mitchell CM. Phase determination by the two-wavelength method of Okaya and Pepinsky. Acta Cryst. 1957;10:475–476. [Google Scholar]
- Moore JO, Hendrickson WA. An Asymmetry-to-Symmetry Switch in Signal Transmission by the Histidine Kinase Receptor for TMAO. Structure. 2012;20:729–741. doi: 10.1016/j.str.2012.02.021. [DOI] [PMC free article] [PubMed] [Google Scholar]
- Nagem RA, Ambrosio AL, Rojas AL, Navarro MV, Golubev AM, Garratt RC, Polikarpov I. Getting the most out of X-ray home sources. Acta Crystallogr D. 2005;61:1022–1030. doi: 10.1107/S0907444905012989. [DOI] [PubMed] [Google Scholar]
- Nagem RA, Dauter Z, Polikarpov I. Protein crystal structure solution by fast incorporation of negatively and positively charged anomalous scatterers. Acta Crystallogr D. 2001;57:996–1002. doi: 10.1107/s0907444901007260. [DOI] [PubMed] [Google Scholar]
- Nakagawa A, Higuchi Y, Yasuoka N, Katsube Y, Yagi T. S-class cytochromes c have a variety of folding patterns: structure of cytochrome c-553 from Desulfovibrio vulgaris determined by the multi-wavelength anomalous dispersion method. J Biochem. 1990;108:701–703. doi: 10.1093/oxfordjournals.jbchem.a123267. [DOI] [PubMed] [Google Scholar]
- Nishikawa S, Matukawa K. Hemihedry of Zincblende and X-Ray Reflexion. Proc Imp Acad Jap. 1928;4:96–97. [Google Scholar]
- Nyblom M, Poulsen H, Gourdon P, Reinhard L, Andersson M, Lindahl E, Fedosova N, Nissen P. Crystal structure of Na+, K(+)-ATPase in the Na(+)-bound state. Science. 2013;342:123–127. doi: 10.1126/science.1243352. [DOI] [PubMed] [Google Scholar]
- Ogata CM, Hendrickson WA. Protein Structures from MAD Experiments at the Howard Hughes Medical Institute Beam Line X4A at NSLS. Synchrotron Radiation News. 1995;8 (3):13–18. [Google Scholar]
- Okaya Y, Saito Y, Pepinsky R. New Method in X-ray Crystal Structure Determination Involving the Use of Anomalous Dispersion. Physical Review. 1955;98:1857–1858. [Google Scholar]
- Okaya Y, Pepinsky R. New formulation and solution of the phase problem in x-ray analysis of noncentric crystals containing anomalous scatterers. Phys Rev. 1956;103:1645–1647. [Google Scholar]
- Ormö M, Cubitt AB, Kallio K, Gross LA, Tsien RY, Remington SJ. Crystal structure of the Aequorea victoria green fluorescent protein. Science. 1996;273:1392–1395. doi: 10.1126/science.273.5280.1392. [DOI] [PubMed] [Google Scholar]
- Otwinowski Z. Isomorphous Replacement and Anomalous Scattering. In: Wolf W, Evans PR, Leslie AGW, editors. SERC. Daresbury Laboratory; Warrington: 1991. pp. 80–86. [Google Scholar]
- Otwinowski Z, Minor W. Processing of X-ray diffraction data collected in oscillation mode. Methods Enzymol. 1997;276:307–326. doi: 10.1016/S0076-6879(97)76066-X. [DOI] [PubMed] [Google Scholar]
- Pähler A, Smith JL, Hendrickson WA. A Probability Representation for Phase Information from Multiwavelength Anomalous Dispersion. Acta Crystallogr A. 1990;46:537–540. doi: 10.1107/s0108767390002379. [DOI] [PubMed] [Google Scholar]
- Palczewski K, Kumasaka T, Hori T, Behnke CA, Motoshima H, Fox BA, Le Trong I, Teller DC, Okada T, Stenkamp RE, Yamamoto M, Miyano M. Crystal structure of rhodopsin: A G protein-coupled receptor. Science. 2000;289:739–745. doi: 10.1126/science.289.5480.739. [DOI] [PubMed] [Google Scholar]
- Panjikar S, Parthasarathy V, Lamzin VS, Weiss MS, Tucker PA. On the combination of molecular replacement and single-wavelength anomalous diffraction phasing for automated structure determination. Acta Crystallogr D. 2009;65:1089–1097. doi: 10.1107/S0907444909029643. [DOI] [PMC free article] [PubMed] [Google Scholar]
- Patterson AL. A Fourier Series Method for the Determination of the Components of Interatomic Distances in Crystals. Physical Review. 1934;46:372–376. [Google Scholar]
- Patterson AL. A direct method for the determination of the components of interatomic distances in crystals. Zeitschrift für Kristallographie. 1935;90:517–542. [Google Scholar]
- Payandeh J, Scheuer T, Zheng N, Catterall WA. The crystal structure of a voltage-gated sodium channel. Nature. 2011;475:353–358. doi: 10.1038/nature10238. [DOI] [PMC free article] [PubMed] [Google Scholar]
- Perraskis A, Morris R, Lamzin VS. Automated protein model building combined with iterative structure refinement. Nature Struct Biol. 1999;6:458–463. doi: 10.1038/8263. [DOI] [PubMed] [Google Scholar]
- Perutz MF, Rossmann MG, Cullis AF, Muirhead H, Will G, North AC. Structure of haemoglobin: a three-dimensional Fourier synthesis at 5.5-A. resolution, obtained by X-ray analysis. Nature. 1960;185:416–422. doi: 10.1038/185416a0. [DOI] [PubMed] [Google Scholar]
- Phillips JC, Hodgson KO. The use of anomalous scattering effects to phase diffraction patterns from macromolecules. Acta Crystallogr A. 1980;36:856–864. [Google Scholar]
- Phillips JC, Templeton DH, Templeton LK, Hodgson KO. LIII-Edge Anomalous X-ray Scattering by Cesium Measured with Synchrotron Radiation. Science. 1978;201:257–259. doi: 10.1126/science.201.4352.257. [DOI] [PubMed] [Google Scholar]
- Pomeranz Krummel DA, Oubridge C, Leung AK, Li J, Nagai K. Crystal structure of human spliceosomal U1 snRNP at 5.5 A resolution. Nature. 2009;458:475–480. doi: 10.1038/nature07851. [DOI] [PMC free article] [PubMed] [Google Scholar]
- Prins JA. Über die Dispersion und Absorption von Röntgenstrahlen. Zeitschrift für Physik. 1928;48:479–498. [Google Scholar]
- Purdy MD, Ge P, Chen J, Selvin PR, Wiener MC. Thiol-reactive lanthanide chelates for phasing protein X-ray diffraction data. Acta Cryst D. 2002;58:1111–1117. doi: 10.1107/s0907444902006509. [DOI] [PubMed] [Google Scholar]
- Qi R, Sarbeng EB, Liu Q, Le KQ, Xu X, Xu H, Yang J, Wong JL, Vorvis C, Hendrickson WA, Zhou L, Liu Q. Allosteric opening of the polypeptide-binding site when an Hsp70 binds ATP. Nat Struct Mol Biol. 2013;20:900–907. doi: 10.1038/nsmb.2583. [DOI] [PMC free article] [PubMed] [Google Scholar]
- Ramachandran GN, Raman S. A New Method for the Structure Analysis of Non-Centrosymmetric Crystals. Current Science (India) 1956;25:348–351. [Google Scholar]
- Ramakrishnan V, Biou V. Treatment of Multiwavelength Anomalous Diffraction Data as a Special Case of Multiple Isomorphous Replacement. Methods Enzymol. 1997;276:538–557. [PubMed] [Google Scholar]
- Ramakrishnan V, Finch JT, Graziano V, Lee PL, Sweet RM. Crystal structure of globular domain of histone H5 and its implications for nucleosome binding. Nature. 1993;362:219–223. doi: 10.1038/362219a0. [DOI] [PubMed] [Google Scholar]
- Raman S. Theory of the anomalous dispersion method of determining the structure and absolute configuration of non-centrosymmetric crystals. Proc Indian Acad Sci A. 1959;50:95–107. [Google Scholar]
- Raman CS, Li H, Martásek P, Král V, Masters BS, Poulos TL. Crystal structure of constitutive endothelial nitric oxide synthase: a paradigm for pterin function involving a novel metal center. Cell. 1998;95:939–950. doi: 10.1016/s0092-8674(00)81718-3. [DOI] [PubMed] [Google Scholar]
- Ramaseshan S. Four decades in anomalous scattering – Some reminiscences. Curr Sci. 1993;65:644–651. [Google Scholar]
- Ramaseshan S, Venkatesan K. The Use of Anomalous Scattering without Phase Change in Crystal Structure Analysis. Curr Sci. 1957;26:352–353. [Google Scholar]
- Ramaseshan S, Venkatesan K, Mani NV. The Use of Anomalous Scattering for the Determination of Crystal Structures – KMnO4. Proc Ind Acad Sci A. 1957;46:95–111. [Google Scholar]
- Read RJ, McCoy AJ. Using SAD data in Phaser. Acta Crystallogr D. 2011;67:338–344. doi: 10.1107/S0907444910051371. [DOI] [PMC free article] [PubMed] [Google Scholar]
- Reiter NJ, Osterman A, Torres-Larios A, Swinger KK, Pan T, Mondragón A. Structure of a bacterial ribonuclease P holoenzyme in complex with tRNA. Nature. 2010;468:784–789. doi: 10.1038/nature09516. [DOI] [PMC free article] [PubMed] [Google Scholar]
- Rice LM, Earnest TN, Brunger AT. Single-wavelength Anomalous Diffraction Phasing Revisited. Acta Cryst D. 2000;56:1413–1420. doi: 10.1107/s0907444900010039. [DOI] [PubMed] [Google Scholar]
- Robbins AH, McRee DE, Williamson M, Collett SA, Xuong NH, Furey WF, Wang BC, Stout CD. Refined crystal structure of Cd, Zn metallothionein at 2.0 Å resolution. J Mol Biol. 1991;221:1269–1293. [PubMed] [Google Scholar]
- Robertson JM. An x-ray study of the phthalocyanines. Part II Quantitative structure determination of the metal-free compound. Journal of the Chemical Society. 1936:1195–1209. [Google Scholar]
- Robertson JM, Woodward I. An x-ray study of the phthalocyanines. Part IV Direct quantitative analysis of the platinum compound. Journal of the Chemical Society. 1940:36–48. [Google Scholar]
- Robinson RC, Turbedsky K, Kaiser DA, Marchand JB, Higgs HN, Choe S, Pollard TD. Crystal structure of Arp2/3 complex. Science. 2001;294:1679–1684. doi: 10.1126/science.1066333. [DOI] [PubMed] [Google Scholar]
- Rodgers DW. Cryocrystallography. Structure. 1994;15:1135–1140. doi: 10.1016/s0969-2126(94)00116-2. [DOI] [PubMed] [Google Scholar]
- Rosenbaum G, Holmes KC, Witz J. Synchrotron Radiation as a Source for X-ray Diffraction. Nature. 1971;230:434–437. [Google Scholar]
- Rossmann MG. The position of anomalous scatterers in protein crystals. Acta Crystallogr. 1961;14:383–388. [Google Scholar]
- Rossmann MG. The Molecular Replacement Method. New York: Gordon & Breach; 1972. [Google Scholar]
- Rossmann MG, Blow DM. The detection of sub-units within the crystallographic asymmetric unit. Acta Crystallographica. 1962;15:24–31. [Google Scholar]
- Rudenko G, Henry L, Henderson K, Ichtchenko K, Brown MS, Goldstein JL, Deisenhofer J. Structure of the LDL receptor extracellular domain at endosomal pH. Science. 2002;298:2353–2358. doi: 10.1126/science.1078124. [DOI] [PubMed] [Google Scholar]
- Rudenko G, Henry L, Vonrhein C, Bricogne G, Deisenhofer J. ‘MAD’ly Phasing the Extracellular Domain of the LDL Receptor: a Medium-Sized Protein, Large Tungsten Clusters and Multiple Non-isomorphous Crystals. Acta Cryst. 2003;59:1978–1986. doi: 10.1107/s0907444903021383. [DOI] [PubMed] [Google Scholar]
- Ryu SE, Kwong PD, Truneh A, Porter TG, Arthos J, Rosenberg M, Dai X, Xuong Ng-h, Axel R, Sweet RW, Hendrickson WA. Crystal Structure of an HIV-binding Recombinant Fragment of Human CD4. Nature. 1990;348:419–426. doi: 10.1038/348419a0. [DOI] [PMC free article] [PubMed] [Google Scholar]
- Sawaya MR, Wojtowicz WM, Andre I, Qian B, Wu W, Baker D, Eisenberg D, Zipursky SL. A double S shape provides the structural basis for the extraordinary binding specificity of Dscam isoforms. Cell. 2008;134:1007–1018. doi: 10.1016/j.cell.2008.07.042. [DOI] [PMC free article] [PubMed] [Google Scholar]
- Schuermann JP, Tanner JJ. MRSAD: using anomalous dispersion from S atoms collected at Cu Kalpha wavelength in molecular-replacement structure determination. Acta Crystallogr D. 2003;59:1731–1736. doi: 10.1107/s0907444903015725. [DOI] [PubMed] [Google Scholar]
- Schiltz M, Bricogne G. Exploiting the Anisotropy of Anomalous Scattering Boosts the Phasing Power of SAD and MAD Experiments. Acta Cryst D. 2008;64:711–729. doi: 10.1107/S0907444908010202. [DOI] [PMC free article] [PubMed] [Google Scholar]
- Schiltz M, Fourme R, Prangé T. Use of noble gases xenon and krypton as heavy atoms in protein structure determination. Methods Enzymol. 2003;374:83–119. doi: 10.1016/S0076-6879(03)74004-X. [DOI] [PubMed] [Google Scholar]
- Schneider TR, Sheldrick GM. Substructure solution with SHELXD. Acta Cryst D. 2002;58:1772–1779. doi: 10.1107/s0907444902011678. [DOI] [PubMed] [Google Scholar]
- Schmidt A, Teeter M, Weckert E, Lamzin VS. Crystal structure of small protein crambin at 0.48 Å resolution. Acta Crystallogr F. 2011;67:424–428. doi: 10.1107/S1744309110052607. [DOI] [PMC free article] [PubMed] [Google Scholar]
- Shapiro L, Fannon AM, Kwong PD, Thompson A, Lehmann MS, Grübel G, Legrand JF, Als-Nielsen J, Colman DR, Hendrickson WA. Structural basis of cell-cell adhesion by cadherins. Nature. 1995;374:327–337. doi: 10.1038/374327a0. [DOI] [PubMed] [Google Scholar]
- Shapiro L, Lima CD. The Argonne Structural Genomics Workshop: Lamaze class for the birth of a new science. Structure. 1998;15:265–267. doi: 10.1016/s0969-2126(98)00030-6. [DOI] [PubMed] [Google Scholar]
- Sheldrick GM. Direct Methods for Solving Macromolecular Structures. S. Kluwer Academic Publishers; Dordrecht: 1998. SHELX applications to macromolecules; pp. 401–411. [Google Scholar]
- Sheng J, Huang Z. Selenium derivatization of nucleic acids for x-ray crystal structure and function studies. Chemistry and Biodiversity. 2010;7:753–785. doi: 10.1002/cbdv.200900200. [DOI] [PubMed] [Google Scholar]
- Singh AK, Ramaseshan S. The use of neutron scattering in crystal structure analysis. I Non-centrosymmetric structures Acta Cryst. 1968;B24:35–39. [Google Scholar]
- Smith GD, Nagar B, Rini JM, Hauptman HA, Blessing RH. The use of SnB to determine an anomalous scattering substructure. Acta Crystallogr D. 1998;54:799–804. doi: 10.1107/s0907444997018805. [DOI] [PubMed] [Google Scholar]
- Smith JL, Hendrickson WA, Addison AW. Structure of trimeric haemerythrin. Nature. 1983;303:86–88. doi: 10.1038/303086a0. [DOI] [PubMed] [Google Scholar]
- Smith JL, Hendrickson WA. Multiwavelength anomalous diffraction. International Tables for Crystallography F. 2001:299–303. [Google Scholar]
- Sheriff S, Hendrickson WA, Smith JL. Structure of Myohemerythrin in the Azidomet State at 1.7/1.3Å Resolution. J Mol Biol. 1987;197:273–296. doi: 10.1016/0022-2836(87)90124-0. [DOI] [PubMed] [Google Scholar]
- Son SK, Chapman HN, Santra R. Multiwavelength anomalous diffraction at high x-ray intensity. Phys Rev Lett. 2011;107:218102. doi: 10.1103/PhysRevLett.107.218102. [DOI] [PubMed] [Google Scholar]
- Staudenmann J-L, Hendrickson WA, Abramowitz R. The synchrotron resource of the Howard Hughes Medical Institute. Rev Sci Instrum. 1989;60:1939–1942. [Google Scholar]
- Strub MP, Hoh F, Sanchez JF, Strub JM, Böck A, Aumelas A, Dumas C. Selenomethionine and selenocysteine double labeling strategy for crystallographic phasing. Structure. 2003;11:1359–1367. doi: 10.1016/j.str.2003.09.014. [DOI] [PubMed] [Google Scholar]
- Stuhrmann S, Bartels KS, Braunwarth W, Doose R, Dauvergne F, Gabriel A, Knöchel A, Marmotti M, Stuhrmann HB, Trame C, Lehmann MS. Anomalous Dispersion with Edges in the Soft X-ray Region: First Results of Diffraction from Single Crystals of Trypsin Near the K-Absorption Edge of Sulfur. J Synchrotron Radiat. 1997;4:298–310. doi: 10.1107/S0909049597009059. [DOI] [PubMed] [Google Scholar]
- Sutton RB, Fasshauer D, Jahn R, Brunger AT. Crystal structure of a SNARE complex involved in synaptic exocytosis at 2.4 A resolution. Nature. 1998;395:347–353. doi: 10.1038/26412. [DOI] [PubMed] [Google Scholar]
- Templeton DH, Templeton LK. X-ray dichroism and polarized anomalous scattering of the uranyl ion. Acta Crystallogr A. 1982;38:62–67. [Google Scholar]
- Templeton LK, Templeton DH. Biaxial tensors for anomalous scattering of X-rays in selenolanthionine. Acta Crystallogr A. 1988;44:478–481. doi: 10.1107/s0108767388007810. [DOI] [PubMed] [Google Scholar]
- Templeton DH, Templeton LK, Phillips JC, Hodgson KO. Anomalous scattering of X-rays by cesium and cobalt measured with synchrotron radiation. Acta Crystallogr A. 1980;36:436–442. [Google Scholar]
- Templeton DH, Templeton LK, Phizackerley RP, Hodgson KO. L3-edge anomalous scattering by gadolinium and samarium measured at high resolution with synchrotron radiation. Acta Crystallogr A. 1982;38:74–78. [Google Scholar]
- Terwilliger TC. MAD phasing: Bayesian estimates of FA. Acta Crystallogr D. 1994;50:11–16. doi: 10.1107/S0907444993008224. [DOI] [PubMed] [Google Scholar]
- Terwilliger TC. Maximum-likelihood density modification. Acta Cryst D. 2000;56:965–972. doi: 10.1107/S0907444900005072. [DOI] [PMC free article] [PubMed] [Google Scholar]
- Terwilliger TC. Automated main-chain model building by template matching and iterative fragment extension. Acta Crystallogr D. 2003a;59:38–44. doi: 10.1107/S0907444902018036. [DOI] [PMC free article] [PubMed] [Google Scholar]
- Terwilliger TC. Automated side-chain model building and sequence assignment by template matching. Acta Crystallogr D. 2003b:45–49. doi: 10.1107/S0907444902018048. [DOI] [PMC free article] [PubMed] [Google Scholar]
- Terwilliger TC, Berendzen J. Automated MAD and MIR structure solution. Acta Crystallographica D. 1999;55:849–861. doi: 10.1107/S0907444999000839. [DOI] [PMC free article] [PubMed] [Google Scholar]
- Thomson JJ. Conduction of Electricity through Gases. Cambridge: Cambridge University Press; 1906. [Google Scholar]
- Thygesen J, Weinstein S, Franceschi F, Yonath A. The Suitability of Multi-metal Clusters for Phasing in Crystallography of Large Macromolecular Assemblies. Structure. 1996;4:513–518. doi: 10.1016/s0969-2126(96)00057-3. [DOI] [PubMed] [Google Scholar]
- Tollin P. Determination of the orientation and position of the myoglobin molecule in the crystal of seal myoglobin. J Mol Biol. 1969;45:481–490. doi: 10.1016/0022-2836(69)90307-6. [DOI] [PubMed] [Google Scholar]
- Turner MA, Yuan CS, Borchardt RT, Hershfield MS, Smith GD, Howell PL. Structure determination of selenomethionyl S-adenosylhomocysteine hydrolase using data at a single wavelength. Nat Struct Biol. 1998;5:369–376. doi: 10.1038/nsb0598-369. [DOI] [PubMed] [Google Scholar]
- Walsh MA, Evans G, Sanishvili R, Dementieva I, Joachimiak A. MAD data collection - current trends. Acta Crystallogr D. 1999;55:1726–1732. doi: 10.1107/s0907444999008392. [DOI] [PubMed] [Google Scholar]
- Wang B-C. Resolution of Phase Ambiguity in Macromolecular Crystallography. Methods Enzymol. 1985;115:90–112. doi: 10.1016/0076-6879(85)15009-3. [DOI] [PubMed] [Google Scholar]
- Ward KB, Hendrickson WA, Klippenstein GL. Quaternary and Tertiary Structure of Hemerythrin. Nature. 1975;257:818–821. doi: 10.1038/257818a0. [DOI] [PubMed] [Google Scholar]
- Warkentin M, Thorne RE. Glass transition in thaumatin crystals revealed through temperature-dependent radiation-sensitivity measurements. Acta Crystallogr D. 2010;66:1092–1100. doi: 10.1107/S0907444910035523. [DOI] [PMC free article] [PubMed] [Google Scholar]
- Watson JD. Structure and Function of Proteins at the Three-Dimensional Level. XXXVI. Cold Spring Harbor Laboratory; 1972. Cold Spring Harbor Symposia on Quantitative Biology. [Google Scholar]
- Weis WI, Kahn R, Fourme R, Drickamer K, Hendrickson WA. Structure of the Calcium-dependent Lectin Domain from a Rat Mannose-binding Protein Determined by MAD Phasing. Science. 1991;254:1608–1615. doi: 10.1126/science.1721241. [DOI] [PubMed] [Google Scholar]
- Weiss MS, Sicker T, Djinovic-Carugo K, Hilgenfeld R. On the routine use of soft X-rays in macromolecular crystallography. Acta Crystallogr D. 2001;57:689–695. doi: 10.1107/s0907444901003572. [DOI] [PubMed] [Google Scholar]
- White TA, Barty A, Stellato F, Holton JM, Kirian RA, Zatsepin NA, Chapman HN. Crystallographic data processing for free-electron laser sources. Acta Crystallogr D. 2013;69:1231–1240. doi: 10.1107/S0907444913013620. [DOI] [PMC free article] [PubMed] [Google Scholar]
- Wimberly BT, Brodersen DE, Clemons WM, Jr, Morgan-Warren RJ, Carter AP, Vonrhein C, Hartsch T, Ramakrishnan V. Structure of the 30S ribosomal subunit. Nature. 2000;407:327–339. doi: 10.1038/35030006. [DOI] [PubMed] [Google Scholar]
- Wilson IA, Skehel JJ, Wiley DC. Structure of the haemagglutinin membrane glycoprotein of influenza virus at 3 A resolution. Nature. 1981;289:366–373. doi: 10.1038/289366a0. [DOI] [PubMed] [Google Scholar]
- Wu H, Kwong PD, Hendrickson WA. Dimeric association and segmental variability in the structure of human CD4. Nature. 1997;387:527–530. doi: 10.1038/387527a0. [DOI] [PubMed] [Google Scholar]
- Wu H, Lustbader JW, Liu Y, Canfield RE, Hendrickson WA. Structure of Human Chorionic Gonadotropin at 2.6Å Resolution from MAD Analysis of the Selenomethionyl Protein. Structure. 1994;2:545–558. doi: 10.1016/s0969-2126(00)00054-x. [DOI] [PubMed] [Google Scholar]
- Wyckoff RWG. The X-ray scattering powers of nickel and oxygen in nickel oxide. Physical Review. 1930;35:583–587. [Google Scholar]
- Xiao R, Anderson S, Aramini J, Belote R, Buchwald WA, Ciccosanti C, Conover K, Everett JK, Hamilton K, Huang YJ, Janjua H, Jiang M, Kornhaber GJ, Lee DY, Locke JY, Ma LC, Maglaqui M, Mao L, Mitra S, Patel D, Rossi P, Sahdev S, Sharma S, Shastry R, Swapna GV, Tong SN, Wang D, Wang H, Zhao L, Montelione GT, Acton TB. The high-throughput protein sample production platform of the Northeast Structural Genomics Consortium. J Struct Biol. 2010;172:21–33. doi: 10.1016/j.jsb.2010.07.011. [DOI] [PMC free article] [PubMed] [Google Scholar]
- Yamashita A, Singh SK, Kawate T, Jin Y, Gouaux E. Crystal structure of a bacterial homologue of Na+/Cl--dependent neurotransmitter transporters. Nature. 2005;437:215–223. doi: 10.1038/nature03978. [DOI] [PubMed] [Google Scholar]
- Yang C, Pflugrath JW. Applications of anomalous scattering from S atoms for improved phasing of protein diffraction data collected at Cu Kalpha wavelength. Acta Crystallogr D. 2001;57:1480–1490. doi: 10.1107/s0907444901013397. [DOI] [PubMed] [Google Scholar]
- Yang C, Pflugrath JW, Courville DA, Stence CN, Ferrara JD. Away from the edge: SAD phasing from the sulfur anomalous signal measured in-house with chromium radiation. Acta Crystallogr D. 2003;59:1943–1957. doi: 10.1107/s0907444903018547. [DOI] [PubMed] [Google Scholar]
- Yang W, Hendrickson WA, Crouch RJ, Satow Y. Structure of ribonuclease H phased at 2 Å resolution by MAD analysis of the selenomethionyl protein. Science. 1990;249:1398–1405. doi: 10.1126/science.2169648. [DOI] [PubMed] [Google Scholar]
- Zhang KYJ, Main P. Histogram matching as a new density modification technique for phase refinement and extension of protein molecules. Acta Cryst. 1990;A46:41–46. [Google Scholar]
- Zhou Y, MacKinnon R. The occupancy of ions in the K+ selectivity filter: charge balance and coupling of ion binding to a protein conformational change underlie high conduction rates. J Mol Biol. 2003;333:965–975. doi: 10.1016/j.jmb.2003.09.022. [DOI] [PubMed] [Google Scholar]
- Zhu X, Zhao X, Burkholder WF, Gragerov A, Ogata CM, Gottesman ME, Hendrickson WA. Structural analysis of substrate binding by the molecular chaperone DnaK. Science. 1996;272:1606–1614. doi: 10.1126/science.272.5268.1606. [DOI] [PMC free article] [PubMed] [Google Scholar]
Associated Data
This section collects any data citations, data availability statements, or supplementary materials included in this article.