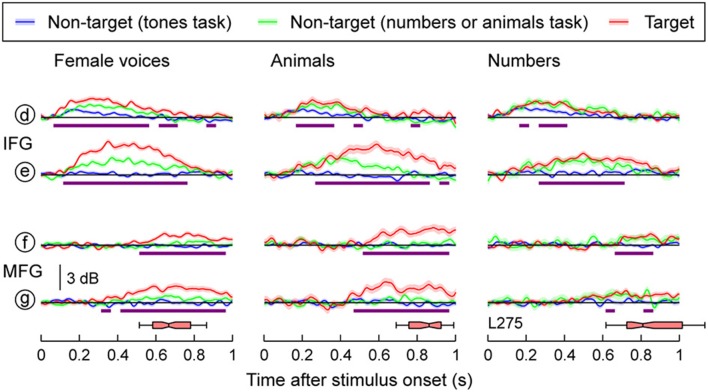
Figure 5.
Task effects on responses to speech stimuli in IFG and MFG. High gamma responses to three types of stimuli (female voices, animals, numbers; columns), presented in three different tasks (blue, green and red plots), are shown for two recording sites on the IFG and two sites on MFG. See Figure 3A for location of the sites. Lines and shaded areas represent mean high gamma ERBP and its standard error, respectively. Purple bars denote time windows where responses to the target stimuli were significantly larger than those to the same stimuli in the tones task (q < 0.01). Horizontal box plots denote the timing of behavioral responses to the target stimuli (medians, 10th, 25th, 75th, and 90th percentiles).

